✓Oct 23 session - Last update: Oct 23, 2026, 10:10 AM ET

⚠️Material / Earnings✓High confidence
Source: earnings_events
Changes History →BestStocks detects meaningful changes across price, volume, earnings, filings, valuation, analyst revisions, and risk signals — and shows you the evidence behind each one.
Investment research built around change detection.
BestStocks identifies what changed across companies and sectors, explains why it matters, and helps investors spot opportunities worth investigating.
What changed: Flagstar Financial, Inc. (FLG) reported Q3 FY2026 EPS of $0.01 versus a consensus estimate of $0.07, missing by 86.2% on 2026-10-23.
Source: earnings_events
Changes History →FLG earnings scheduled for 2027-01-29 with a consensus EPS estimate of $0.12.
What changed: Crown Castle Inc. (CCI) moved -5.55% from $91.02 to $85.97 on 2026-10-23, despite reporting Q3 FFO of $1.24/share—exceeding the consensus estimate of $1.20/share—and raising its 2026 guidance for site rental revenues, EBITDA, and AFFO. Volume traded at 2.8x the 5-day average.
Source: daily_prices:fmp_change_percent
Changes History →Monitor CCI's next earnings report (scheduled 2027-02-03) for updates on divestiture progress and confirmation of the raised AFFO and EBITDA targets.
What changed: Maplebear Inc. (CART) moved +9.87% from $51.37 to $56.44 on 2026-10-23, closing at a new 30-day high on volume 5.3x the 5-day average. We checked news, earnings announcements, analyst updates, SEC filings, and corporate actions — no company-specific catalyst was found.
Source: daily_prices:fmp_change_percent
Changes History →CART earnings report on 2026-11-05 and actual EPS result versus the $0.63 consensus estimate.
What changed: Axsome Therapeutics, Inc. (AXSM) moved -6.00% from $154.30 to $145.04 on 2026-10-23, reaching a new 30-day low on significantly elevated volume (2.2x the 5-day average). We checked news, earnings, analyst updates, filings, and corporate actions — no company-specific catalyst was found on the announcement date.
Source: daily_prices:fmp_change_percent
Changes History →AXSM earnings scheduled for 2026-11-02, with consensus EPS estimate of -$0.62.
What changed: SBA Communications Corporation (SBAC) moved -5.77% from $196.06 to $184.75 on 2026-10-23, with volume 2.5x the 5-day average. The decline follows a recent rally driven by SpaceX's $8 billion spectrum acquisition, which had boosted expectations for increased infrastructure and leasing demand at cell tower operators like SBAC. Analyst upgrades from firms including Jefferies, Wells Fargo, and Bernstein had supported the prior momentum ahead of Q3 2026 earnings.
Source: daily_prices:fmp_change_percent
Changes History →Q3 2026 earnings scheduled for 2026-11-02, with consensus EPS estimate of $2.09.
What changed: American Tower Corporation (AMT) moved -5.85% from $200.72 to $188.97 on 2026-10-23, despite earlier premarket strength tied to reports that SpaceX is negotiating access to tens of thousands of cellular tower sites for a nationwide wireless-carrier expansion. Volume was 2.8x the 5-day average, suggesting institutional positioning ahead of AMT's Q3 earnings report scheduled for October 27, 2026.
Source: daily_prices:fmp_change_percent
Changes History →AMT's Q3 2026 earnings announcement on October 27, 2026, including guidance and commentary on SpaceX and 5G deployment momentum.
What changed: First Citizens BancShares, Inc. (FCNCA) reported EPS of $55.37 vs. consensus estimate of $46.18, beating expectations by 19.9% for Q3 FY2026 on October 23, 2026.
Source: earnings_events
Changes History →FCNCA's Q4 FY2026 earnings announcement on January 22, 2027 (date not yet confirmed).

What changed: First Citizens BancShares, Inc. Depositary Shares, each representing a 1/40th interest in a share of 6.625% Non-Cumulative Perpetual Preferred Stock, Series E (FCNCN) reported EPS of $55.37 vs. consensus estimate of $46.18, beating by 19.9% for Q3 FY2026 on October 23, 2026.
Source: earnings_events
Changes History →FCNCN's next earnings are scheduled for January 22, 2027, with a consensus EPS estimate of $48.61.
What changed: Booz Allen Hamilton Holding Corporation (BAH) reported EPS of $1.76 vs. $1.48 consensus estimate for Q2 FY2027, beating consensus by 18.9%.
Source: earnings_events
Changes History →Monitor BAH's FY2027 full-year guidance and management commentary on revenue growth and operating margin sustainability in the coming quarters.
What changed: Twist Bioscience Corporation (TWST) moved +5.18% from $132.95 to $139.84 on October 23, 2026. We checked news, earnings, analyst updates, filings, and corporate actions — no company-specific catalyst was found. The move appears to reflect positive momentum in the synthetic biology and biotech sectors, with volume near its 5-day average.
Source: daily_prices:fmp_change_percent
Changes History →TWST earnings on November 13, 2026.
What changed: AeroVironment, Inc. (AVAV) moved +6.66% from $115.55 to $123.25 on 2026-10-23. We checked news, earnings announcements, analyst updates, SEC filings, and corporate actions — no company-specific catalyst was found. Volume remained near its 5-day average, suggesting the move was not driven by unusual trading activity.
Source: daily_prices:fmp_change_percent
Changes History →AVAV earnings are scheduled for 2026-12-08 with a consensus EPS estimate of $0.37.
What changed: Oscar Health, Inc. (OSCR) moved -6.32% from $33.08 to $30.99 on 2026-10-23. We checked news, earnings announcements, analyst updates, SEC filings, and corporate actions — no company-specific catalyst was found. Volume traded near its 5-day average, suggesting the move was not driven by unusual trading activity.
Source: daily_prices:fmp_change_percent
Changes History →OSCR earnings report on 2026-11-05 (consensus EPS estimate: -$0.14).
In-depth equity research from the BestStocks desk — earnings breakdowns, valuation deep dives, and sector analysis behind the changes we detect.
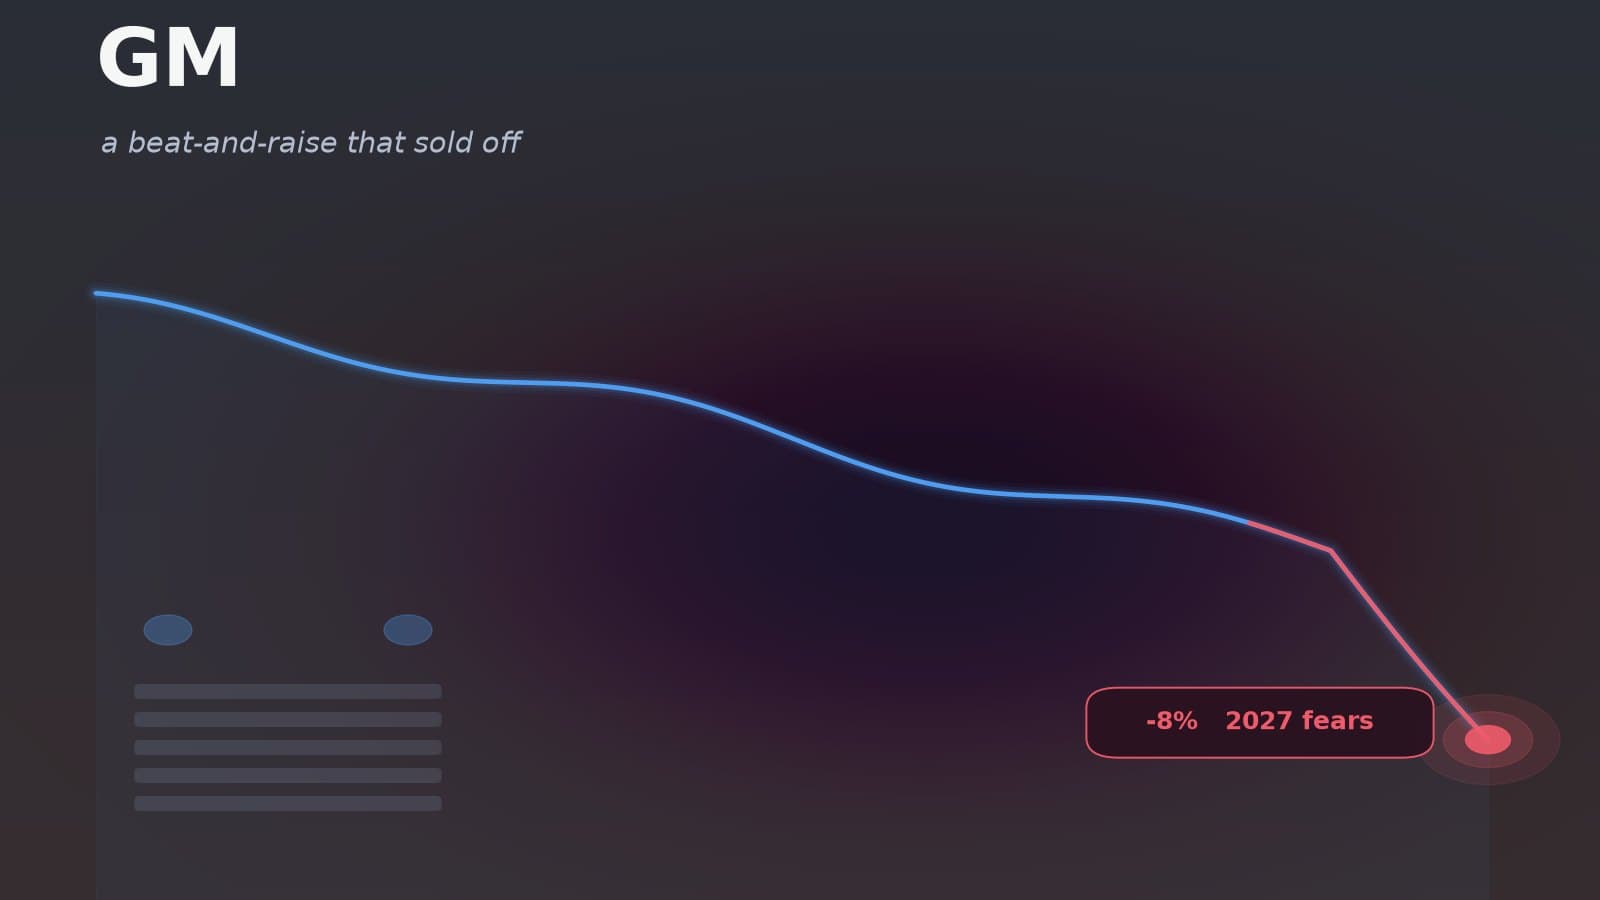
General Motors fell about 8% to roughly $75.77 on October 20 — a striking reaction, because GM beat on third-quarter earnings, raised its full-year profit outlook and announced a $20 billion buyback. Adjusted earnings of $3.70 a share topped estimates on revenue of about $50 billion, and GM lifted the midpoint of its full-year adjusted-EPS guidance to about $13.25 (from $13.00) and raised its free-cash-flow outlook. The stock fell anyway on what the guidance implied, not the quarter. The full-year outlook implies a softer fourth quarter — only about $2.7 billion of operating profit versus $4.1 billion in the third, as a Silverado/Sierra redesign temporarily cuts truck deliveries by roughly 35,000 units — the raised $13.25 EPS midpoint still landed just below the roughly $13.41 the Street expected, and management flagged about $2 billion of 2026 cost inflation plus a conditional scenario of more in 2027. Two things that look like culprits mostly were not: the 62% drop in EV sales was already known and reflects a distorted 2025 comparison, and tariff costs are now expected near the low end of an existing range. Crucially, GM did not cut its 2027 outlook — it still expects next year to improve if conditions hold. The move was clearly company-specific — Ford fell only about 1%, Stellantis was flat and the S&P 500 rose — so this was a repricing of GM's forward earnings, not an auto-sector sell-off. The valuation captures the tension: GM trades at barely five to six times the forward earnings it guides to, extraordinarily cheap, because the market prices automakers for the downturn, not the peak. A $20 billion buyback into that multiple is powerfully accretive if earnings hold — but whether they hold in 2027 is exactly the question. Analysts keep a Buy consensus and an average target near $104.
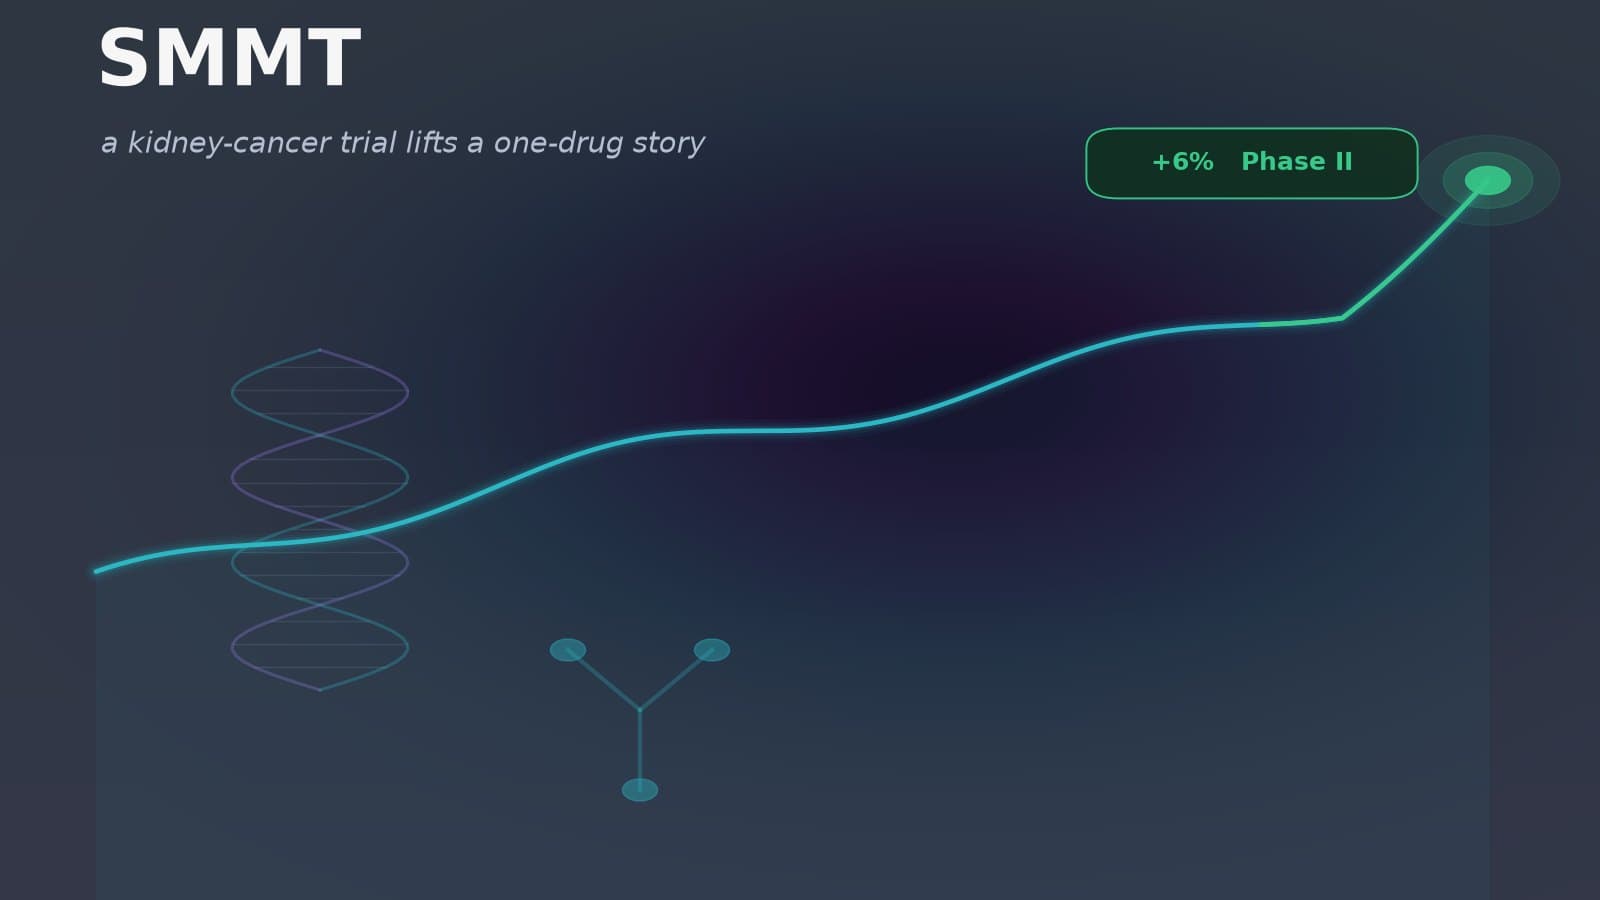
Summit Therapeutics rose about 6% to roughly $15.57 on October 19 after announcing it had opened a global Phase II trial of ivonescimab — its closely watched lead drug — in previously untreated advanced clear cell kidney cancer, with partner Akeso. The key nuance: this is the opening of a mid-stage study, not a data readout, so it is an incremental catalyst that expands the story rather than one that proves it. Summit is effectively a one-drug company: ivonescimab is a PD-1/VEGF bispecific antibody, licensed from China's Akeso, that outperformed Merck's Keytruda in a Chinese lung-cancer trial — nearly doubling progression-free survival and, in updated data, delivering a significant overall-survival benefit (30.8 vs 22.6 months) — though the global trial behind its U.S. filing has yet to formally confirm that survival benefit in Western patients. With no product revenue and a market value above $12 billion, essentially all of Summit's worth is the market's bet on that drug, so a new indication is a fresh call option on the thesis. Two bigger items frame it: AstraZeneca agreed in late September to invest about $2 billion in Summit equity (a ~12% stake), transforming the balance sheet and removing the financing overhang, and the FDA has a November 14, 2026 decision date on ivonescimab in EGFR-mutated lung cancer — a near-term, binary catalyst that matters far more than a trial start. Monday's move was partly company-specific and partly a tailwind: biotech broadly rallied, with the sector ETF up about 2.5%, but Summit outperformed. The risks are a binary valuation on one molecule, an unconfirmed Western survival benefit, and a stock down roughly 47% from its high. Analysts carry a Buy consensus and an average target near $30, inside a wide range from about $12 to the mid-$40s.
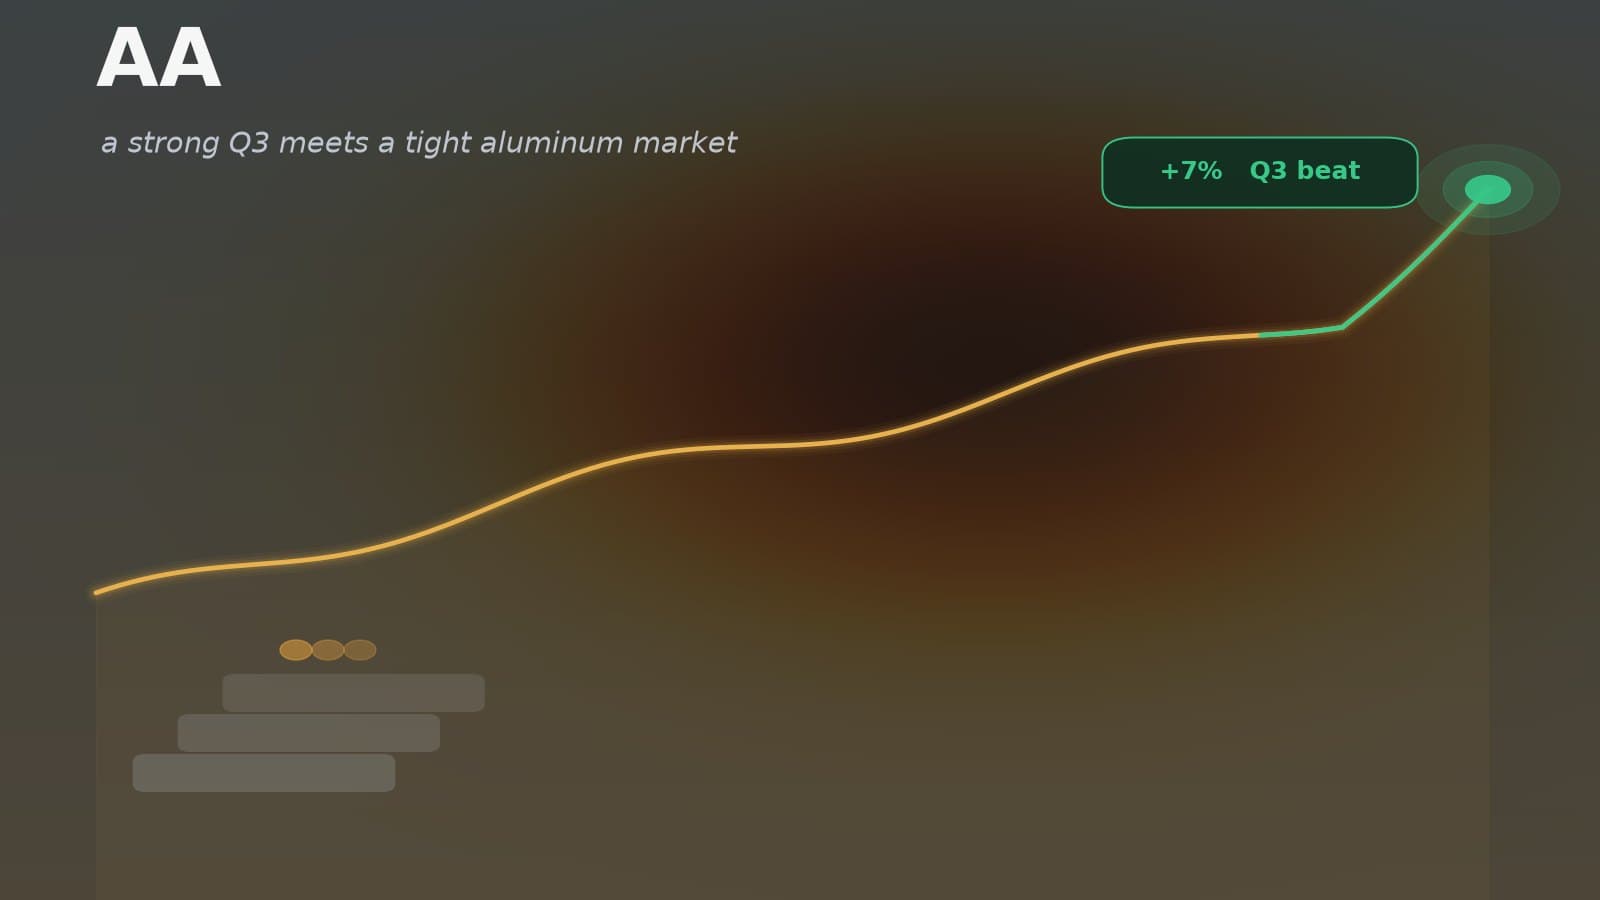
Alcoa rose about 7% to roughly $43.20 on October 16, in the first full session after reporting third-quarter results after the close on October 15. Two forces drove it. First, a genuine earnings beat: adjusted earnings of about $1.82 a share topped the roughly $1.54 expected, with net income of $483 million and free cash flow of $472 million, powered by record production, the completed Alumar smelter restart, and higher alumina prices that offset lower aluminum prices and higher carbon costs — though revenue of about $3.7 billion slightly missed and adjusted EBITDA fell sequentially. Second, and just as important, a broad bid for aluminum stocks on a tightening-supply narrative: peers Century Aluminum (+4.5%) and Kaiser Aluminum (+2.4%) and the materials sector (+1.5%) all rose while the market was flat, so Alcoa led a group move rather than rallying alone — a point underscored by Barclays' Overweight initiation two days earlier citing constrained supply through 2026. Alcoa is a cheap, high-beta cyclical, trading around 7 times earnings and still about 49% below its intra-year high, with earnings that swing on volatile metal prices and a tariff overhang. Analysts carry a Buy consensus and an average target near $60, so the debate is less about execution — which was strong — than about where aluminum prices and trade policy go next.
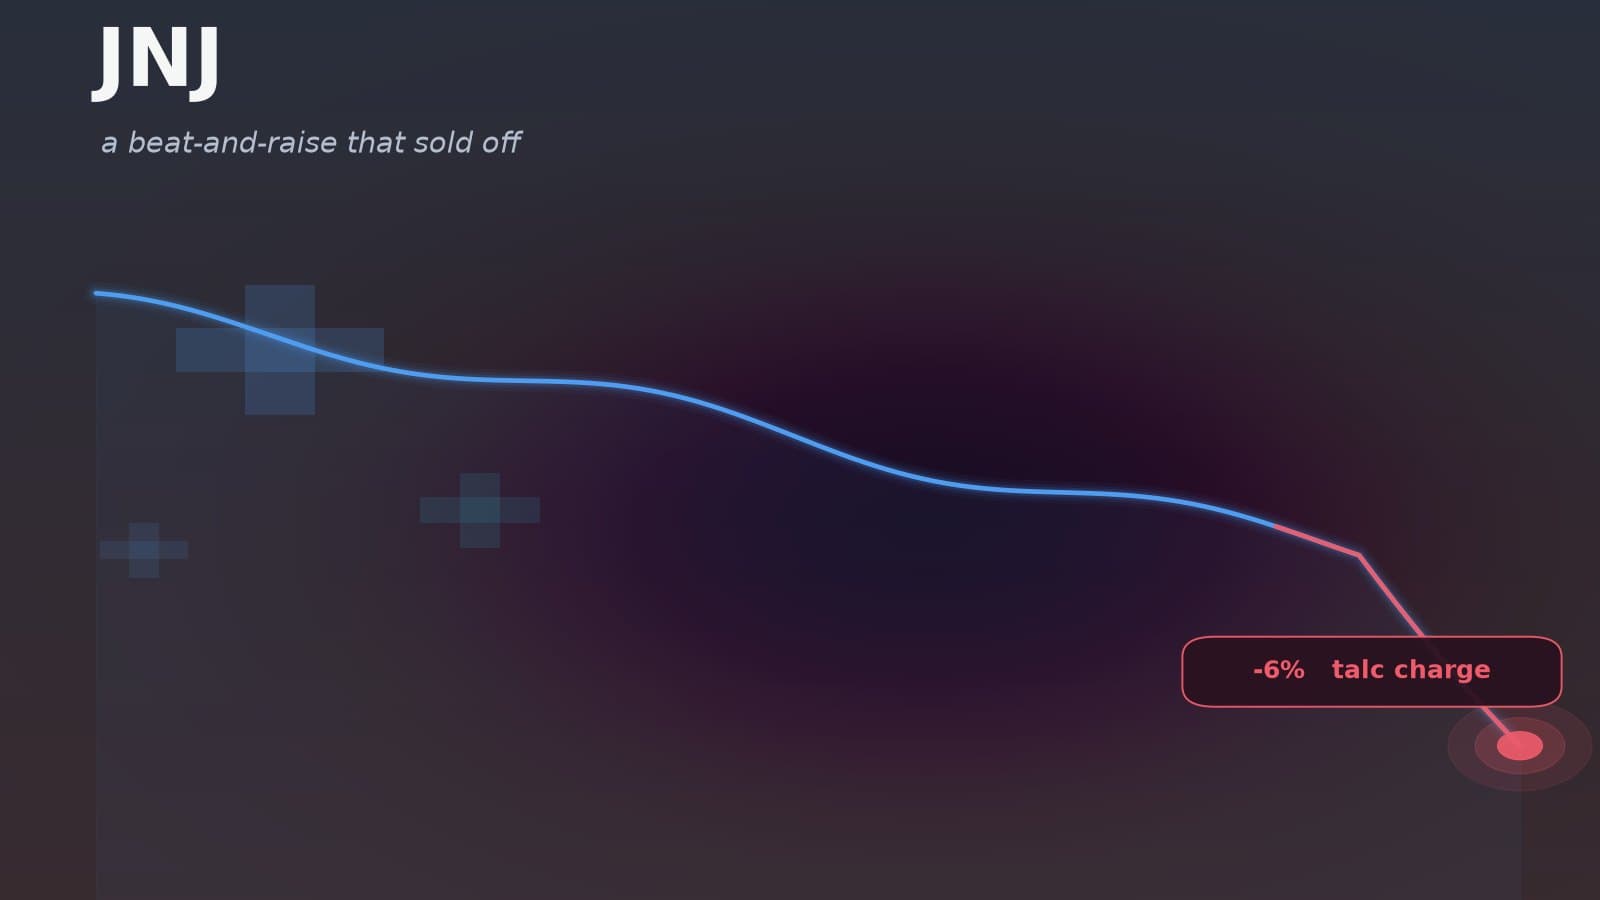
Johnson & Johnson fell about 6% to roughly $247.63 on October 13 after third-quarter results — an unusually large move for a defensive Dow stalwart with a beta near 0.21. The strange part: at the headline it was a beat-and-raise. Adjusted earnings of $2.59 topped estimates and the company raised full-year guidance, lifting adjusted EPS to about $11.10 at the midpoint and putting sales on track to cross $100 billion for the first time. The stock fell anyway, and the main reason was the device business: MedTech sales of about $8.6 billion grew just 2.5% and missed Wall Street's estimate for a second straight quarter, against a strong 7.9% for the Innovative Medicine drug division. On top of that, the guidance raise was modest, the adjusted 'beat' was still down about 7.5% from a year earlier, and the stock had run up about 30% over the past year, leaving it priced for good news. A separate, largely accounting story grabbed headlines: reported GAAP net income collapsed to about $210 million (EPS of $0.09) on roughly $7.6 billion of special charges, about $5.5 billion of it a talc-litigation provision — but that settlement had been announced back in July, so the quarter merely booked the charge rather than breaking news. Pharma peers and the market barely moved, confirming a company-specific drop. The trailing P/E near 30 looks alarming but is distorted by the charges; on adjusted earnings the stock trades closer to 22 times forward. Analysts keep a Buy consensus with an average target near $280, above the price.
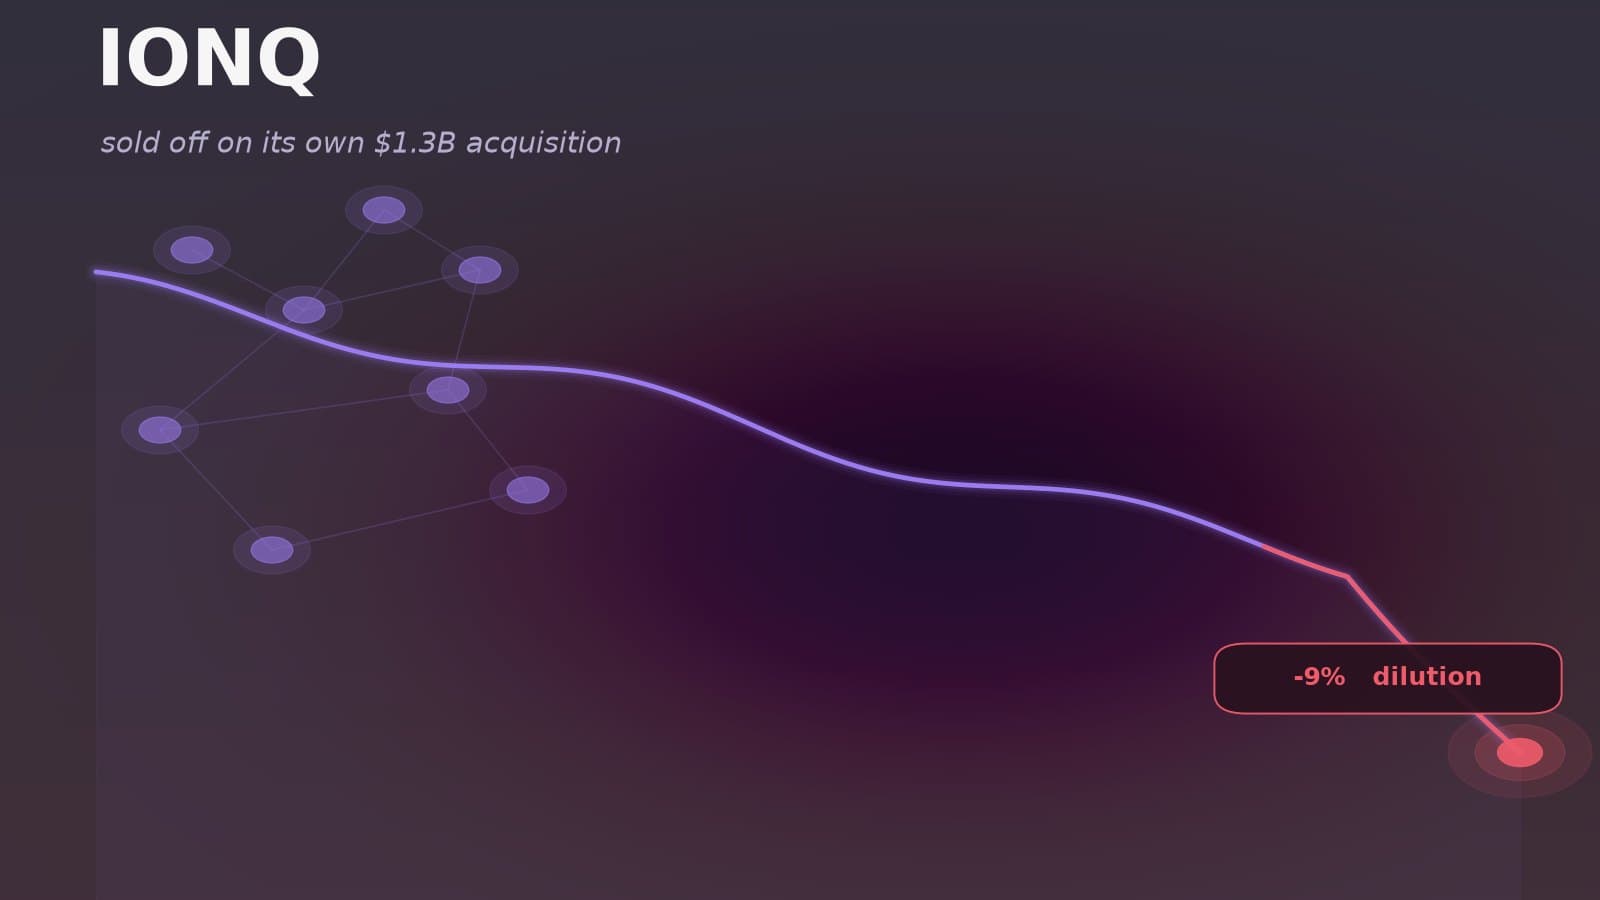
IonQ fell about 9% to roughly $36 on October 12 on a day it announced a definitive agreement to acquire Elisity, a zero-trust cybersecurity company, in an all-stock deal worth up to $1.3 billion. The counterintuitive part is the point: a stock dropping on its own acquisition. The all-stock structure is why — IonQ's share count is already up about 50% over the past year as it funds an acquisition-and-fundraising spree largely with stock, and Elisity is its third billion-dollar-scale deal in roughly 16 months, after the mostly-stock Oxford Ionics purchase and the cash-and-stock SkyWater acquisition. The strategic logic is forward-looking (pairing post-quantum cryptography with Elisity's zero-trust platform to sell 'quantum-era' security), but the market read the news as more dilution and more strategic sprawl from a pre-profit company valued near $14 billion on just $246 million of revenue — about 58 times sales, with an operating margin near negative 380%. A sign of company-specific pressure: IonQ fell about 9% while quantum peers Rigetti and D-Wave fell closer to 5.5% and the Nasdaq-100 slipped under 1% — more than the sector alone would explain. Wall Street stays overwhelmingly bullish on the long-term quantum roadmap — a Strong Buy consensus with an average target far above the price — which is exactly why a story stock like this swings so violently on news.
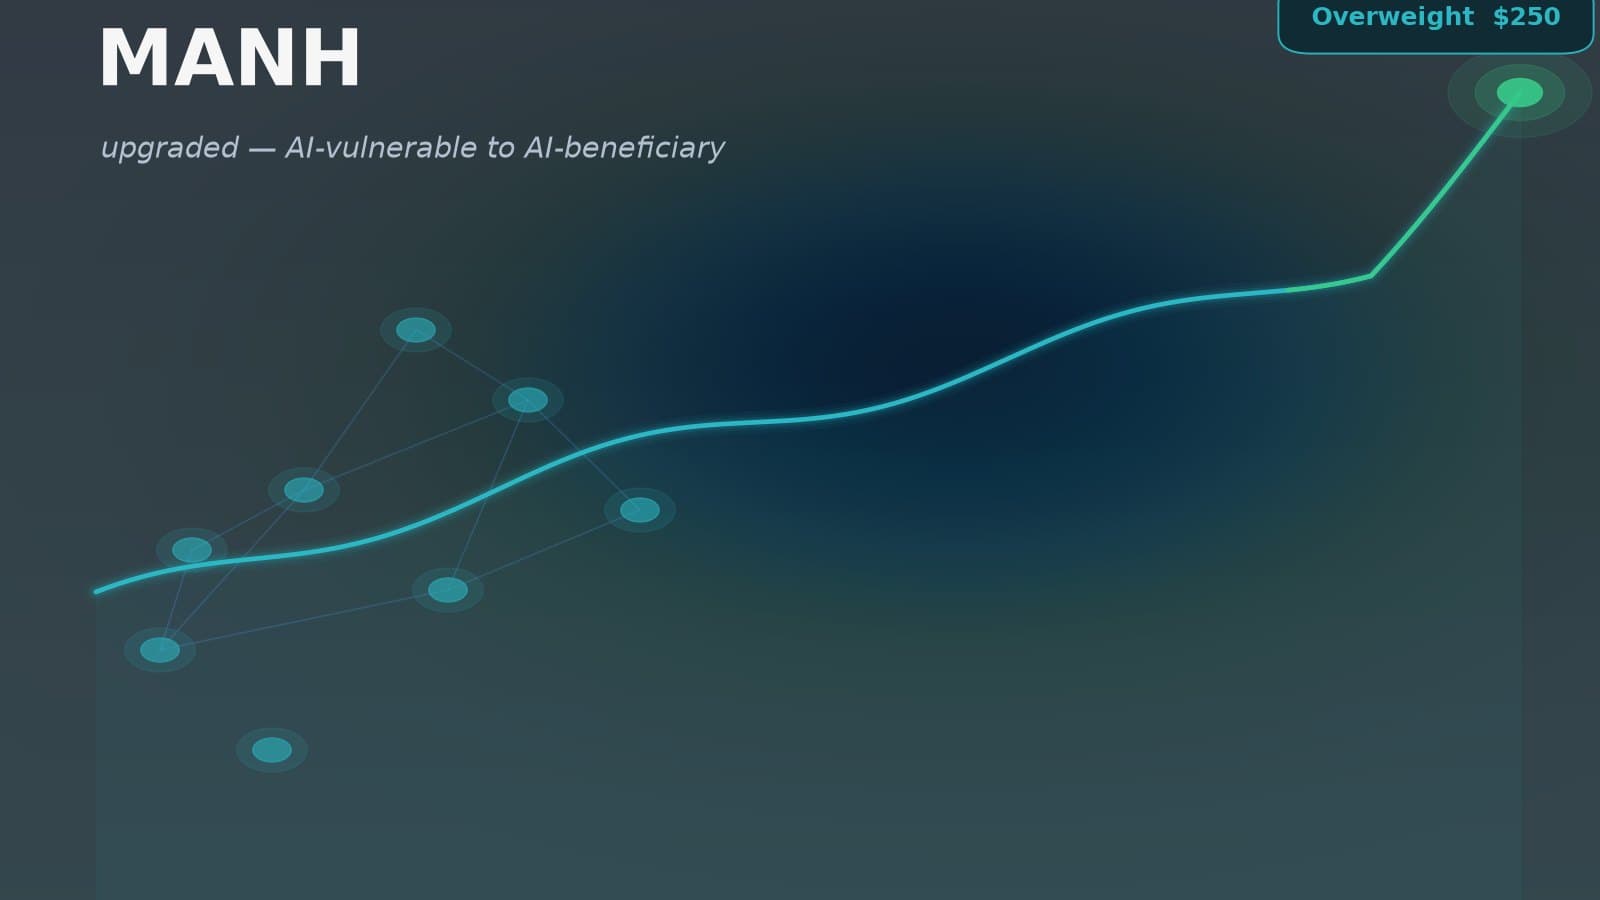
Manhattan Associates jumped about 5.5% to roughly $216 on October 12 — after running as high as about $221 — on a Morgan Stanley upgrade to Overweight from Equalweight and a price-target raise to $250 from $180. The move bucked a down software tape: supply-chain peers were flat and the software sector fell, marking this as an idiosyncratic, catalyst-driven move. Analyst Chris Quintero leaned on three points — accelerating cloud subscription bookings under CEO Eric Clark, a narrative shift from Manhattan being seen as AI-vulnerable to an AI beneficiary via its agentic-AI suite, and a more attractive valuation — while citing only about 1–2% upside to consensus revenue, a tell that this is a re-rating of sentiment as much as of the numbers. The business is a genuinely profitable, cash-generative franchise (56% gross margins, ~25% operating margins, a net-cash balance sheet, ~$400M of free cash flow, cloud revenue up in the mid-20s percent), but it is not cheap: near a 52-week high at ~62x trailing and ~37x forward earnings after a ~70% six-month run, the upgrade pushed it to within a few percent of the ~$228 average analyst target. The next hard test is third-quarter earnings on October 27.