

Why Figma, Inc. (FIG) Stock Rose 9.0% on Aug 10, 2026
The clearest new catalyst: Rebound from the post-earnings selloff (interpretation).
Why did FIG stock rise?
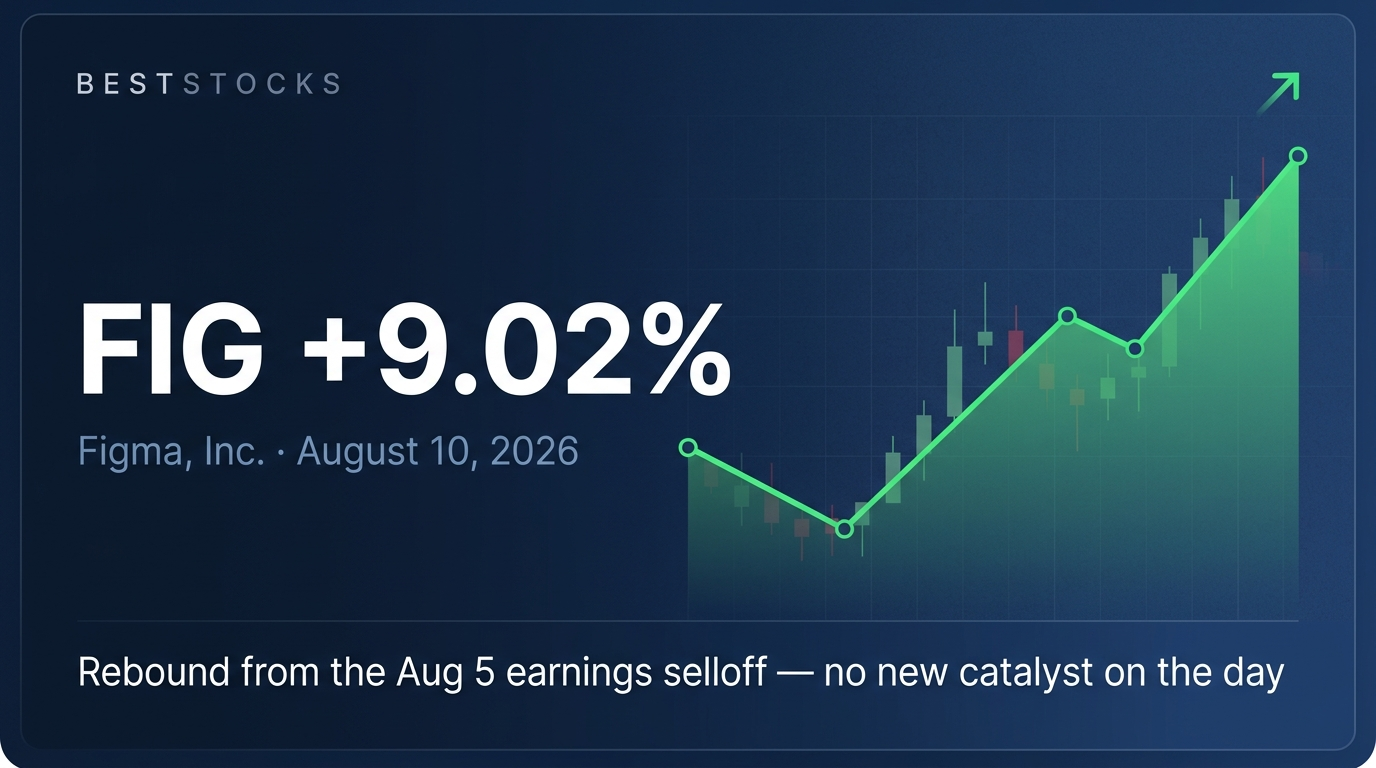
Figma rose 9.02% on August 10, 2026, closing at $25.39 against a prior close of $23.29, with no new company-specific catalyst identified for the session. The move is best read as a rebound from the sharp selloff that followed the company's August 5 second-quarter report, and it came as the broader software complex recovered — Adobe rose 2.92%, Salesforce 2.47%, ServiceNow 2.05% and Datadog 11.48% — even though the S&P 500 slipped 0.06% and the Nasdaq Composite fell 0.32%. Notably, FIG opened at $22.90, below Friday's close, traded as low as $22.80 and then reversed to finish at $25.39, near its $25.46 session high.
- Rebound from the post-earnings selloff (interpretation): Figma reported Q2 FY26 on August 5 and the stock fell roughly 14-15% on August 6 as investors focused on surging AI and compute costs and compressing margins. August 10's advance is consistent with a relief rebound from that decline rather than a reaction to fresh news — an interpretation of the trading pattern, not a confirmed cause.
- Intraday reversal, not a gap-up on news: The stock opened at $22.90 — below the $23.29 prior close — fell to $22.80, then rallied all session to close at $25.39 against a $25.46 high. A move that begins lower and builds through the day points to buyers stepping in, not to a headline hitting before the open.
- Broad software-sector recovery: Software names that had sold off alongside Figma the previous week advanced on August 10: Adobe +2.92%, Salesforce +2.47%, ServiceNow +2.05%, Shopify +2.38% and Datadog +11.48%. This was a group rotation, not a market-wide rally — the S&P 500 fell 0.06% and the Nasdaq Composite fell 0.32%.
- August 5 results (background, not the same-day catalyst): Q2 FY26 revenue was $370.08 million, up 48.2% year over year, with adjusted EPS of $0.08 against a comparable consensus of roughly $0.04 — a modest beat on an adjusted basis, alongside a GAAP net loss of about $112.2 million for the quarter. Full-year revenue guidance was raised. This landed on August 5, three sessions before this one.
- Citigroup price-target raise (background, August 7): Citigroup maintained a Buy rating and raised its price target from $35 to $37 on Friday, August 7 — supportive context heading into the week, but not an August 10 event.
- Elevated short interest may have amplified the move: Short interest was reported at roughly 42% of the float as of July. That can exaggerate a rebound, but no evidence of actual short covering on August 10 was identified, so a short squeeze is not established.
How the story developed
- August 5, 2026Figma reported Q2 FY26: revenue $370.08M (+48.2% y/y), adjusted EPS $0.08 versus roughly $0.04 consensus, a GAAP net loss of about $112.2M, and raised full-year revenue guidance — alongside sharply higher AI and compute costs.
- August 6, 2026Shares fell roughly 14-15% as the market focused on margin compression, dragging the broader software group lower with them.
- August 7, 2026Citigroup maintained a Buy rating and raised its price target from $35 to $37.
- August 10, 2026FIG opened at $22.90 — below the $23.29 prior close — bottomed at $22.80, then reversed to close at $25.39 (+9.02%), near its $25.46 high, on volume of 25.59 million shares (about 1.12x average). No company-specific news was identified for the session.
What it could mean for FIG investors
The constructive case
- The intraday reversal from below the prior close to near the session high suggests buyers were willing to step in after the post-earnings decline.
- Underlying growth remains strong on the reported figures — 48.2% year-over-year revenue growth and raised full-year revenue guidance — and the broader software group recovering on the same day provided a supportive backdrop.
The cautious case & what could invalidate it
- No company-specific catalyst was identified for August 10, so the advance rests on sentiment and positioning rather than new fundamental information.
- The concerns that drove the August 6 selloff — rising AI and compute costs and compressing margins — were not resolved by this session's move.
- Roughly 42% reported short interest cuts both ways: it can amplify rebounds and it can amplify declines, and no short-covering evidence was confirmed here.
- A renewed software-sector selloff could unwind the rebound as quickly as it developed; the stock is still well below its $91.00 52-week high.
Initial detection
BestStocks first flagged FIG intraday on Aug 10, 2026; this analysis was finalized after the close using the confirmed +9.0% session move and additional catalyst research.
Show the initial intraday note
Figma, Inc. (FIG) reported EPS of $0.08 vs. $0.04 consensus estimate, beating by 95.0% for Q2 FY2026.
What to watch next: Monitor FIG's next earnings announcement on 2026-08-14 for guidance on whether this beat reflects a sustainable improvement or a one-quarter anomaly.
Other developments that session
Figma, Inc. (FIG) moved +9.02% on 2026-08-10, from a $23.29 prior close to a $25.39 close, having opened lower at $22.90 and reversed through the session. We checked news, earnings announcements, analyst updates, SEC filings, and corporate actions — no company-specific catalyst was found for this session. The move came on roughly 1.12x the recent average volume (25.59 million shares), three sessions after the company's August 5, 2026 second-quarter report.
Figma, Inc. (FIG) filed a new 8-K on 2026-08-05. The filing contents were not detailed in available sources.
Frequently asked questions
Why did Figma, Inc. (FIG) stock rise on Aug 10, 2026?
Figma rose 9.02% on August 10, 2026, closing at $25.39 against a prior close of $23.29, with no new company-specific catalyst identified for the session. The move is best read as a rebound from the sharp selloff that followed the company's August 5 second-quarter report, and it came as the broader software complex recovered — Adobe rose 2.92%, Salesforce 2.47%, ServiceNow 2.05% and Datadog 11.48% — even though the S&P 500 slipped 0.06% and the Nasdaq Composite fell 0.32%. Notably, FIG opened at $22.90, below Friday's close, traded as low as $22.80 and then reversed to finish at $25.39, near its $25.46 session high.
How much did FIG stock rise on Aug 10, 2026?
FIG rose 9.0% during the Aug 10, 2026 trading session.
What were the main drivers behind FIG's move?
Rebound from the post-earnings selloff (interpretation); Intraday reversal, not a gap-up on news; Broad software-sector recovery; August 5 results (background, not the same-day catalyst); Citigroup price-target raise (background, August 7); Elevated short interest may have amplified the move.