

Why Rivian Automotive, Inc. (RIVN) Stock Fell 9.6% on Jul 31, 2026
The clearest new catalyst: Headline beat, weaker underlying mix.
Why did RIVN stock fall?
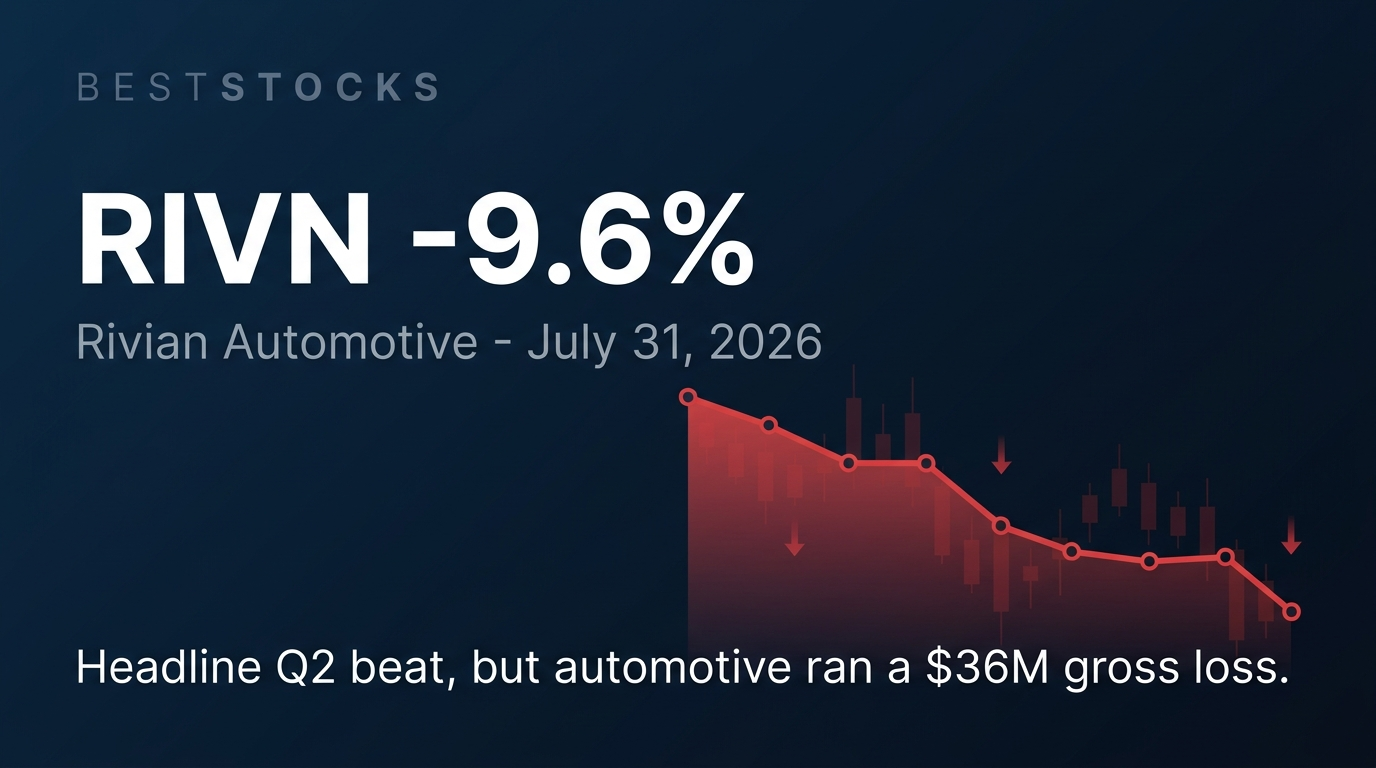
Rivian fell 9.57% to $15.22 on July 31, the session after a Q2 2026 report whose headline numbers beat estimates. Consolidated revenue rose 27% to $1.658 billion and consolidated gross profit reached $179 million, but the automotive segment itself still ran a $36 million gross loss — the $215 million of gross profit came from software and services, and automotive results were helped by regulatory-credit revenue and an IEEPA tariff-refund receivable that Rivian did not size. Adjusted EBITDA improved to a $379 million loss from $667 million a year earlier, and the genuinely new guidance was a tighter adjusted EBITDA range of negative $1.8-2.0 billion and reduced capex of $1.7-1.8 billion.
- Headline beat, weaker underlying mix: Consolidated gross profit of $179M looked strong, but the automotive segment posted a $36M gross loss while software and services contributed $215M. Automotive also benefited from regulatory-credit revenue and a tariff-refund receivable of undisclosed size, so the beat was not evidence that vehicle production had independently reached positive gross margin.
- R2 ramp costs: Rivian recorded roughly $100 million of incremental cost of revenue in the quarter tied to the R2 ramp.
- New guidance was narrower than it looked: The 65,000-70,000 delivery range was raised on July 2 and merely reiterated on July 30. What was new on earnings night was the tighter adjusted EBITDA loss range ($1.8-2.0B) and reduced capex ($1.7-1.8B).
- Dilution overhang from the completed July offering: The recently completed share offering remained a dilution overhang: Rivian ultimately sold 86.25 million shares for about $1.317 billion in net proceeds. This was background, not a July 31 announcement.
- Analyst reaction was mildly constructive: RBC Capital maintained Sector Perform and raised its price target to $16 from $14 on July 31.
How the story developed
- July 2, 2026Rivian raised its full-year 2026 delivery guidance to 65,000-70,000 units.
- July 6, 2026After the close, Rivian launched an equity offering of 75 million shares; the stock fell roughly 9% in after-hours trading.
- July 7, 2026Shares fell about 18% in the regular session on the offering. Rivian ultimately sold 86.25 million shares for approximately $1.317 billion in net proceeds.
- July 30, 2026Q2 2026 results after the close: revenue $1.658B (+27%), consolidated gross profit $179M, adjusted EBITDA loss $379M, 12,613 vehicles produced at Normal and 12,194 delivered. Guidance tightened on adjusted EBITDA and capex; the delivery range was reiterated. Shares gained nearly 2% in extended trading.
- July 31, 2026Shares reversed to close down 9.57% at $15.22. RBC Capital maintained Sector Perform and raised its target to $16 from $14.
What it could mean for RIVN investors
The constructive case
- Adjusted EBITDA loss narrowed sharply to $379 million from $667 million a year earlier, and management tightened the full-year range while cutting capex — the cash-burn trajectory is improving.
- Software and services generated $215 million of gross profit, a higher-margin stream that is starting to carry consolidated profitability.
- RBC raised its price target on the print even while keeping a Sector Perform rating, suggesting the quarter did not damage the medium-term thesis.
The cautious case & what could invalidate it
- The automotive segment still ran a $36 million gross loss; consolidated gross profit does not yet show that vehicle manufacturing is independently profitable.
- Automotive results benefited from regulatory-credit revenue and an IEEPA tariff-refund receivable whose contribution Rivian did not disclose, so the quality of the gross-profit beat is hard to assess.
- R2 ramp costs added roughly $100 million of incremental cost of revenue and will continue to weigh on near-term margins.
- Liquidity is materially smaller than the headline "$14 billion" framing implies — much of that figure is targeted future capital contingent on the DOE loan and partner financing.
Initial detection
BestStocks first flagged RIVN intraday on Jul 31, 2026; this analysis was finalized after the close using the confirmed −9.6% session move and additional catalyst research.
Show the initial intraday note
Rivian (RIVN) fell 8.70% to $15.37 intraday and closed down 9.57% at $15.22, reversing after its Q2 2026 report released late July 30. The quarter beat on revenue at $1.658 billion, up 27%, and the genuinely new guidance was a tighter adjusted EBITDA loss range of $1.8-2.0 billion and reduced capex of $1.7-1.8 billion — the 65,000-70,000 full-year delivery range had already been raised on July 2 and was only reiterated. The decline reflects investor caution about R2 ramp costs of roughly $100 million in the quarter, a $36 million automotive gross loss beneath the consolidated $179 million gross-profit beat, and lingering dilution from the 75-million-share offering launched earlier in July. Volume was elevated at 1.65x normal for the session time.
What to watch next: Upcoming earnings call details (August 4 date pending per schedule) and management commentary on R2 ramp profitability timeline and cash runway.
Other developments that session
Rivian Automotive, Inc. (RIVN) reported EPS of −$0.47 vs. consensus estimate of −$0.66, beating expectations by 29.0% when results were announced on July 30, 2026.
Frequently asked questions
Why did Rivian Automotive, Inc. (RIVN) stock fall on Jul 31, 2026?
Rivian fell 9.57% to $15.22 on July 31, the session after a Q2 2026 report whose headline numbers beat estimates. Consolidated revenue rose 27% to $1.658 billion and consolidated gross profit reached $179 million, but the automotive segment itself still ran a $36 million gross loss — the $215 million of gross profit came from software and services, and automotive results were helped by regulatory-credit revenue and an IEEPA tariff-refund receivable that Rivian did not size. Adjusted EBITDA improved to a $379 million loss from $667 million a year earlier, and the genuinely new guidance was a tighter adjusted EBITDA range of negative $1.8-2.0 billion and reduced capex of $1.7-1.8 billion.
How much did RIVN stock fall on Jul 31, 2026?
RIVN fell 9.6% during the Jul 31, 2026 trading session.
What were the main drivers behind RIVN's move?
Headline beat, weaker underlying mix; R2 ramp costs; New guidance was narrower than it looked; Dilution overhang from the completed July offering; Analyst reaction was mildly constructive.