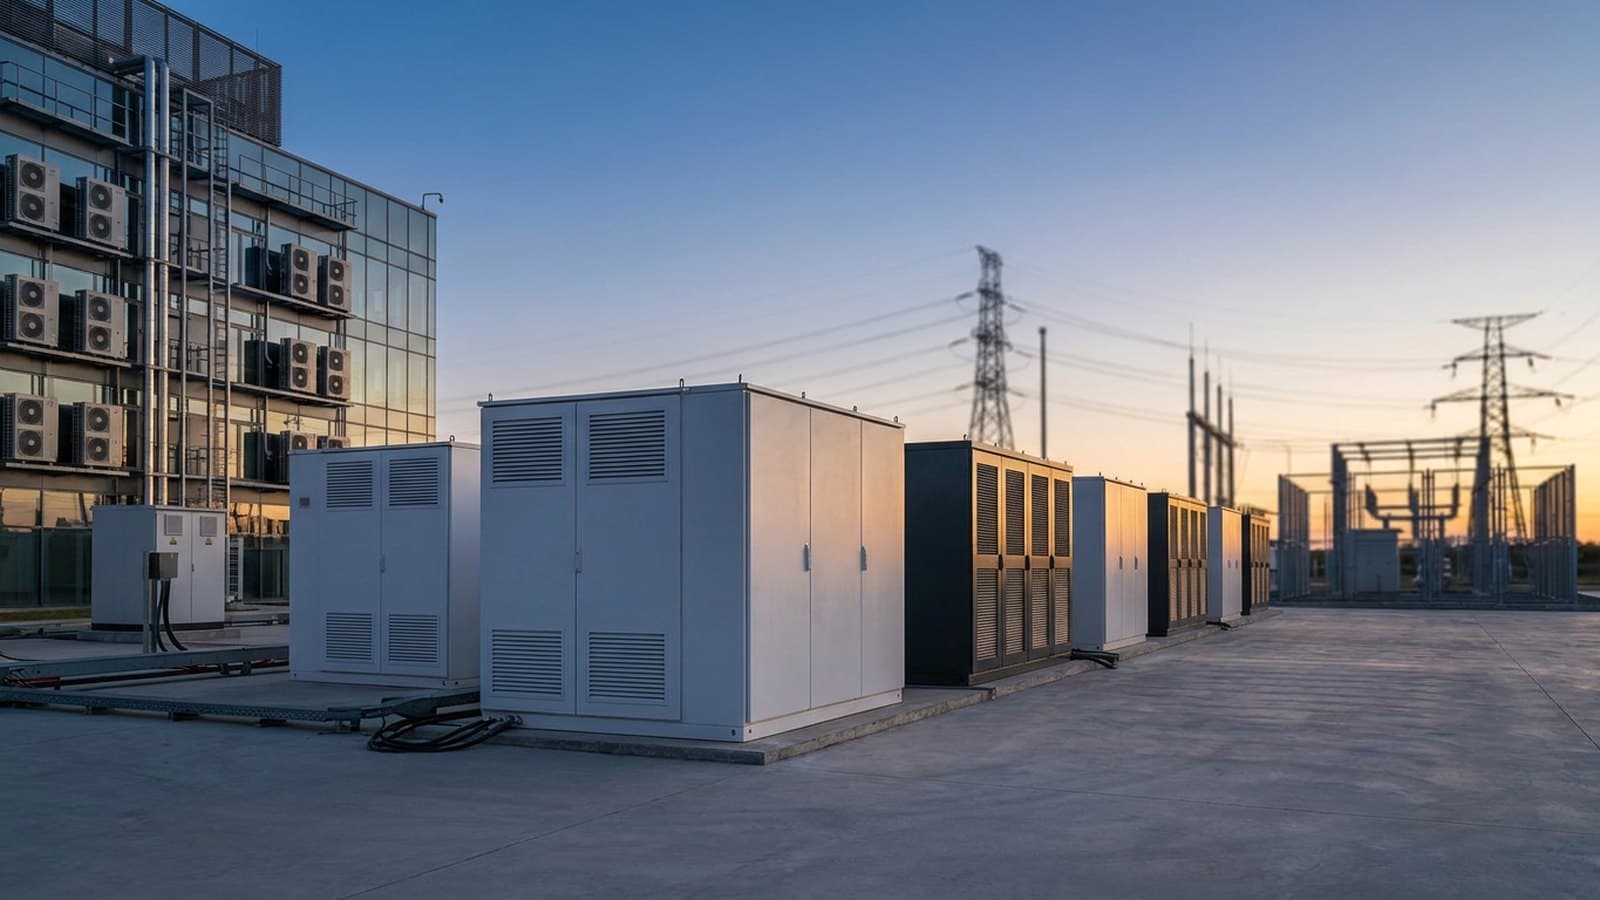
Bloom Energy Corporation (BE) shares tumbled 11.2% to $193.30 as of October 25, 2026, a sharp decline from the prior close of $217.77. BestStocks flagged the session as a major change for BE. Below, we break down what changed for BE, why it matters for investors, how the stock reacted, and the catalysts on the calendar.
What happened
BE fell 11.2% to $193.30
BE tumbled 11.2% in its latest session, moving from $217.77 to $193.30.
RiskMedium confidence
Rel. volume
2.3×
Very High
Vs peers
—
No comparable peers
Market cap
$57.1B
New York Stock Exchange
Analyst target
$291
+50.6% vs price
Price chart
Sep 24 – Oct 23
E earnings
F filing
A analyst
V/N other
click a marker to highlight
Change events — click to jump to details
What it means for Bloom Energy Corporation investors
For Bloom Energy Corporation investors, the recent signals add up to a bearish shift. On the constructive side: Earnings beat — stock sold off (sell-the-news reaction); Positive price momentum. Weighing against that: Sharp 11.2% decline — elevated risk; High volume 2.3x on decline — distribution signal. Wall Street's consensus price target sits at $291.06, implying +50.6% upside from $193.30. Over the past 90 days analysts logged 1 upgrade and 0 downgrades. BestStocks rates the overall signal quality medium (69/100). With earnings roughly 102 days out, the next report is the most likely near-term test of the move.
BE price reaction
BE last traded at $193.30, down $24.47 (-11.24%) from the previous close of $217.77. The session traded on 2.3× average volume (very high), so the move carried above-average conviction. Over the past month the stock has ranged between $193.30 and $295.78, and it currently sits about 0% of the way up that band.
Bullish and bearish analyst opinions on Bloom Energy Corporation (BE)
The consensus analyst price target on Bloom Energy Corporation (BE) is $291.06, 50.6% above the recent $193.30. Over the past 90 days analysts logged 1 upgrade, 24 maintains, and 0 downgrades. Here is how the bullish and bearish cases on BE line up.
▲ The bullish case
+Wall Street's consensus price target of $291.06 implies +50.6% upside from $193.30.
+The Street's most bullish target is $351.00 (+81.6%).
+1 analyst upgrade in the past 90 days, most recently Mizuho to Outperform (2026-07-30).
+Earnings beat — stock sold off (sell-the-news reaction).
+Positive price momentum.
▼ The bearish case
−The most bearish analyst target is $176.00 (-8.9%).
−Sharp 11.2% decline — elevated risk.
−High volume 2.3x on decline — distribution signal.
−Bloom Energy (BE) fell 10.09% to $195.79 following the release of its Q3 earnings report filed today, which revealed a significant cash-flow headwind despite a revenue beat.
−Bloom Energy shares fell 6.51% to $223.01, closing near session lows.
Bull vs bear balanceBearish Shift
BearishNeutralBullish
Weighing both sides, BestStocks' composite read of recent signals is bearish, as the bull-versus-bear meter above shows. This is an educational summary of the bull and bear case, not investment advice.
Analyst price targets and ratings are FMP consensus figures as of Oct 25, 2026; other aggregators may differ. High and low targets show the range of estimates, not forecasts.
Bloom Energy shares fell 6.51% to $223.01, closing near session lows. No company-specific catalyst has emerged today; the decline occurs ahead of earnings scheduled for October 27, with consensus EPS estimate of $0.68 (Motley Fool comparative analysis and upcoming earnings schedule). Volume data remains unreliable this early in the session.
Material / Earnings2026-10-22-8.7%
Bloom Energy Corporation (BE) reported EPS of $0.94 vs. consensus estimate of $0.69, beating consensus by 36.0% on 2026-10-22.
Bloom Energy fell 3.70% to $227.55 as part of a broader AI power sector pullback, driven by credit concerns at CoreWeave (a major AI infrastructure client) regarding mounting debt and borrowing costs, per Barron's. Other AI energy stocks including GE Vernova and Constellation Energy faced similar downward pressure as financing risks weighed on the sector.
RBC Capital reiterated its Outperform rating and $335 price target for Bloom Energy, highlighting a 5GW Virginia policy opportunity in the 2026 Virginia Energy Plan as a favorable framework for fuel-cell deployment (Benzinga, Oct 2). The stock rose 5.68% to $293.35, with volume at 1.67x the time-adjusted average, extending September's 29% gain.
Bloom Energy Corporation moved +12.97% intraday from $262.87 to $296.98. Bloom Energy Rallies 11% as Fuel Cell Selloff Reverses; FuelCell Surges 7%, Plug Power Rises 3%: The fuel cell trade is snapping back, and Bloom Energy (NYSE:BE) is recovering a portion of its sharp prior-session decline as buyers return to the whole group. Bloom Energy stock is up 11% to $290. [2026-09-29]
Bloom Energy Corporation moved +6.09% intraday from $266.65 to $282.88. Bloom Energy Corp (NYSE: BE) stock is trading higher today, up 6.44% to $283.82 , rebounding strongly after a brief sell-off in the previous session.The primary catalysts driving the stock upward today include the company's official reassurance regarding a massive data center contract, structural index buying, and an overall market recovery. ## Bloom Energy Corp (BE) $283.82 6.44% today As of Sep 25, 10:01 AM EDT • Disclaimer 9:30 AM 9:40 AM 9:50 AM 10:00 AM 270 275 280 Prev close $266.65 Sep 25, 2026 9:30 AM - 10:01 AM 1D 5D 1M 6M YTD 1Y 5Y Max| Open 269.91 | Mkt cap $83.53B USD | 52-wk high 351.28 | | High 284.80 | P/E ratio 382.58 | 52-wk low 66.62 | | Low 264.01 | Div yield- | More about Bloom Energy Corp --- ### 📈 Reassurance on Oracle's "Project Jupiter" Shares of Bloom Energy dipped yesterday following news that Oracle (NYSE: ORCL) issued a force majeure notice to its project developer due to regional power and water delays. However, Bloom Energy swiftly clarified on social media and to investors that its massive 2.4-gigawatt fuel cell contract with Oracle remains fully intact. Management confirmed their execution timeline is unchanged and that Oracle remains fully committe
Bloom Energy rose 6.05% to $281.70, likely driven by positive investor sentiment following recent coverage highlighting the company's strong data-center-driven growth and competitive moat (Motley Fool, Sept. 20). Volume of 7.9M shares ran 1.34x normal for this time of session, suggesting healthy participation in the rally.
Bloom Energy announced its inclusion in the S&P 500 index, driving a 9.39% intraday gain to $276.61 (from $252.87). Index inclusion forces passive funds and ETFs tracking the benchmark to add shares, creating automatic buying pressure. Investor enthusiasm also reflects sustained demand for Bloom's solid-oxide fuel cell systems as clean, on-site power solutions for AI data centers.
In-depth BE event analyses
Permanent, dated analyses of BE's most significant sessions.
BE tumbled 11.2% to $193.30. No single company-specific catalyst was confirmed during the move window, and it looks technical.
How much did BE stock fall?
BE lost 11.24% ($24.47) versus the prior close of $217.77, last trading at $193.30 on 2.3× average volume.
When is Bloom Energy Corporation's next earnings date?
BE's next earnings report is estimated for 2027-02-04 — about 102 days away.
What is the analyst price target for BE?
The consensus analyst price target for BE is $291.06, about 50.6% above the current $193.30. Over the past 90 days, analysts recorded 1 upgrade, 24 maintains, and 0 downgrades.
How BestStocks tracks BE
This page is generated automatically by BestStocks' change-detection system after its price and volume cleared BE-specific materiality thresholds, triggering an evidence check. It draws on 20 tracked change events for BE, cross-checked against the data sources listed below. Price, volume, and market-capitalization figures are the live intraday quote as of October 25, 2026 and refresh as new information is detected; for companies with multiple share classes, market-cap figures can differ by data source. Analyst price targets and ratings are FMP consensus. This is an educational summary of what changed and why — not personalized investment advice.