Fermi Inc. Common Stock (FRMI) shares climbed 14.5% to $3.72 as of October 14, 2026, a sharp gain from the prior close of $3.25. BestStocks flagged the session as a major change for FRMI. Below, we break down what changed for FRMI, why it matters for investors, how the stock reacted, and the catalysts on the calendar.
What happened
FRMI climbed 14.5% to $3.72
FRMI climbed 14.5% in its latest session, moving from $3.25 to $3.72.
ActivityMedium confidence
Rel. volume
4.6×
Extreme
Vs peers
—
No comparable peers
Market cap
$2.4B
NASDAQ Global Select
Analyst target
$11
+202.4% vs price
Price chart
Sep 14 – Oct 14
E earnings
F filing
A analyst
V/N other
click a marker to highlight
Change events — click to jump to details
What it means for Fermi Inc. Common Stock investors
For Fermi Inc. Common Stock investors, the balance of recent signals points to a bullish shift. On the constructive side: Material positive event; Strong 14.5% price move with conviction. Weighing against that: Fermi Inc. (FRMI) fell 4.87% to $4.00, hitting a new 1-year low according to DefenseWorld; Fermi Inc. Common Stock (FRMI) moved -6.14% from $5.05 to $4.74 on 2026-09-15. Wall Street's consensus price target sits at $11.25, implying +202.4% upside from $3.72. BestStocks rates the overall signal quality medium (75/100). With earnings roughly 29 days out, the next report is the most likely near-term test of the move.
FRMI price reaction
FRMI last traded at $3.72, up $0.47 (+14.46%) from the previous close of $3.25. The session traded on 4.6× average volume (extreme), so the move carried above-average conviction. Over the past month the stock has ranged between $3.25 and $5.14, and it currently sits about 25% of the way up that band.
Bullish and bearish analyst opinions on Fermi Inc. Common Stock (FRMI)
The consensus analyst price target on Fermi Inc. Common Stock (FRMI) is $11.25, 202.4% above the recent $3.72. Over the past 90 days analysts logged 0 upgrades, 3 maintains, and 0 downgrades. Here is how the bullish and bearish cases on FRMI line up.
▲ The bullish case
+Wall Street's consensus price target of $11.25 implies +202.4% upside from $3.72.
+The Street's most bullish target is $17.00 (+357.0%).
+Material positive event.
+Strong 14.5% price move with conviction.
+Volume 4.6x average — institutional conviction.
▼ The bearish case
−Fermi Inc. (FRMI) fell 4.87% to $4.00, hitting a new 1-year low according to DefenseWorld.
−Fermi Inc. Common Stock (FRMI) moved -6.14% from $5.05 to $4.74 on 2026-09-15.
−Fermi Inc. filed an 8-K (material event) with the SEC today, triggering a 15.64% intraday decline from $7.32 to $6.17.
Bull vs bear balanceBullish Shift
BearishNeutralBullish
Weighing both sides, BestStocks' composite read of recent signals is bullish, as the bull-versus-bear meter above shows. This is an educational summary of the bull and bear case, not investment advice.
Analyst price targets and ratings are FMP consensus figures as of Oct 14, 2026; other aggregators may differ. High and low targets show the range of estimates, not forecasts.
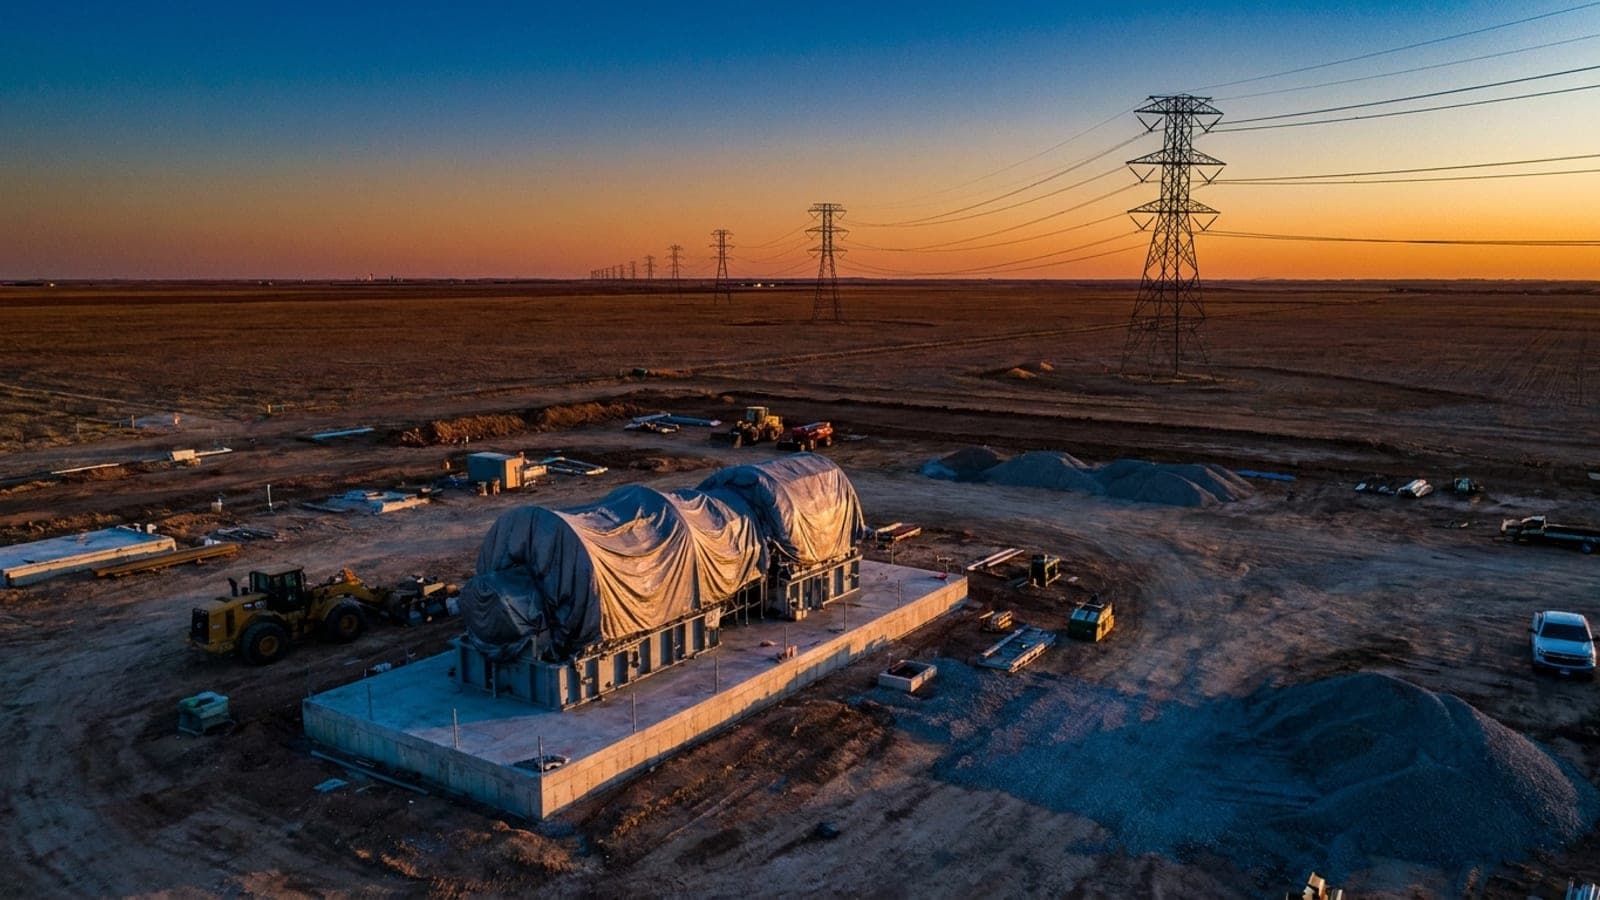
Fermi Inc. declined 5.10% to $3.25, continuing a downward trend near 52-week lows amid investor caution tied to past tenant agreement delays and pre-revenue losses from Project Matador development, according to investing.com and ng.investing.com. The stock has fallen 89% from its 52-week high of $32.39. Volume of 5.19M shares is running at 0.98x the time-adjusted average, indicating normal trading activity.
Material / Earnings2026-10-09-6.3%
Fermi Inc. Common Stock moved -7.17% from $3.69 to $3.43 on 2026-10-09, closing at a new 52-week low. The decline was driven by execution risks and extended timelines on its flagship Project Matador infrastructure site in Texas, with the TensorWave lease closing date pushed to October 31, 2026 as contract and financing details are finalized.
Material / Earnings2026-10-08-7.8%
Fermi Inc. (FRMI) moved -6.39% from $3.91 to $3.66 on October 8, 2026, hitting a new 52-week low. The decline was driven by lingering dilution concerns from the company's recent upsized $350M–$431M convertible note offerings, anxiety over heavy operational cash burn and lack of near-term revenue for Project Matador, and negative public sentiment including critical commentary from Jim Cramer. Unresolved legal and corporate disputes involving ousted founder and former CEO Toby Neugebauer added to the overhang.
Fermi Inc. (FRMI) fell 4.87% to $4.00, hitting a new 1-year low according to DefenseWorld. Volume surged to 6.8M shares, running 2.6x the 60-minute average, signaling elevated selling pressure. The move comes ahead of earnings scheduled for November 9, 2026, where consensus expects a loss of $0.04 per share.
News2026-09-28-5.8%
Fermi contracted NAES to operate and maintain its natural gas turbine fleet for Project Matador.
Risk2026-09-15-6.1%
Fermi Inc. Common Stock (FRMI) moved -6.14% from $5.05 to $4.74 on 2026-09-15. We checked news, earnings, analyst updates, SEC filings, and corporate actions — no company-specific catalyst was found. Volume was 1.4x the 5-day average, indicating modestly elevated trading activity.
Fermi Inc. (FRMI) surged +13.09% to $5.79 following a technical rebound from oversold conditions and renewed investor interest in power-for-AI infrastructure, according to market analysis cited by Google's AI Overview. The stock had faced heavy selling pressure through August and early September after Q2 earnings and cash-burn concerns, creating room for a relief rally. Volume of 13M shares (1.37x average) supports the move, while the broader energy sector benefited from investor enthusiasm for data-center microgrid capacity plays like Fermi's Project Matador.
In-depth FRMI event analyses
Permanent, dated analyses of FRMI's most significant sessions.
Why did Fermi Inc. Common Stock (FRMI) stock move?
FRMI climbed 14.5% to $3.72. No single company-specific catalyst was confirmed during the move window, and it looks technical.
How much did FRMI stock rise?
FRMI gained 14.46% ($0.47) versus the prior close of $3.25, last trading at $3.72 on 4.6× average volume.
When is Fermi Inc. Common Stock's next earnings date?
FRMI's next earnings report is estimated for 2026-11-12 — about 29 days away.
What is the analyst price target for FRMI?
The consensus analyst price target for FRMI is $11.25, about 202.4% above the current $3.72. Over the past 90 days, analysts recorded 0 upgrades, 3 maintains, and 0 downgrades.
How BestStocks tracks FRMI
This page is generated automatically by BestStocks' change-detection system after its price and volume cleared FRMI-specific materiality thresholds, triggering an evidence check. It draws on 20 tracked change events for FRMI, cross-checked against the data sources listed below. Price, volume, and market-capitalization figures are the live intraday quote as of October 14, 2026 and refresh as new information is detected; for companies with multiple share classes, market-cap figures can differ by data source. Analyst price targets and ratings are FMP consensus. This is an educational summary of what changed and why — not personalized investment advice.