Stock Analysis
Why Fermi (FRMI) Stock Fell 15% on July 31, 2026 — a De-Rating With No Headline
Fermi closed July 31 down 15.45% at $5.69, erasing the previous session's 14.85% gain — with no company announcement identified. The conditions around it were structural: sell-side targets cut roughly 60% in five weeks, 12.1 million new shares listed in London two days earlier, and a short base up a quarter in a month against a float of 288 million shares.
Summary
Fermi Inc. (NASDAQ: FRMI) closed Friday, July 31, 2026 at $5.69, down $1.04 or 15.45% from Thursday's $6.73 close — the largest decline on BestStocks' change feed for the session, and the stock's lowest close since June 9 [1][2]. No company-specific filing, press release or same-day analyst action was identified: Fermi lodged nothing with the SEC that day and issued no statement, and our own event page records that "no company-specific catalyst was confirmed during the move window" [1][11]. Nor does it look like a sector move: Oklo (OKLO) fell 5.50%, Vistra (VST) slipped 0.29%, GE Vernova (GEV) rose 0.85%, and the SPDR S&P 500 ETF (SPY) gained 0.72% [6][7][8][9]. What happened instead is that the stock gave back, in a single session, the entire 14.85% gain it had posted the day before. The decline reads as continued repricing after a month of target cuts and financing activity, with an unusually large and fast-covering short base amplifying the swing: Fermi's valuation anchor has more than halved since June, it issued new shares directly in late July on top of a convertible that carries further potential dilution, and short interest grew by a quarter in a month against a float of just 288 million shares.
What changed
Start with the shape of the session. Fermi opened at $6.63 — 1.5% below the prior close — and its high for the day, $6.65, was barely above that open; it closed at $5.69, a penny off its $5.68 low [3]. The daily record gives only open, high, low and close, so the intraday path is not observable from it. But the shape is not the one an overnight disclosure typically produces: there was no meaningful opening gap, and essentially all of the damage was done between the open and the close rather than before it. Volume was 25.5 million shares against a 20-day average of 19.3 million — about 1.32 times normal, elevated enough to show real selling, though well below the 40.5 million shares that changed hands on July 24, when the stock rose 17.09% on company news [3][4].
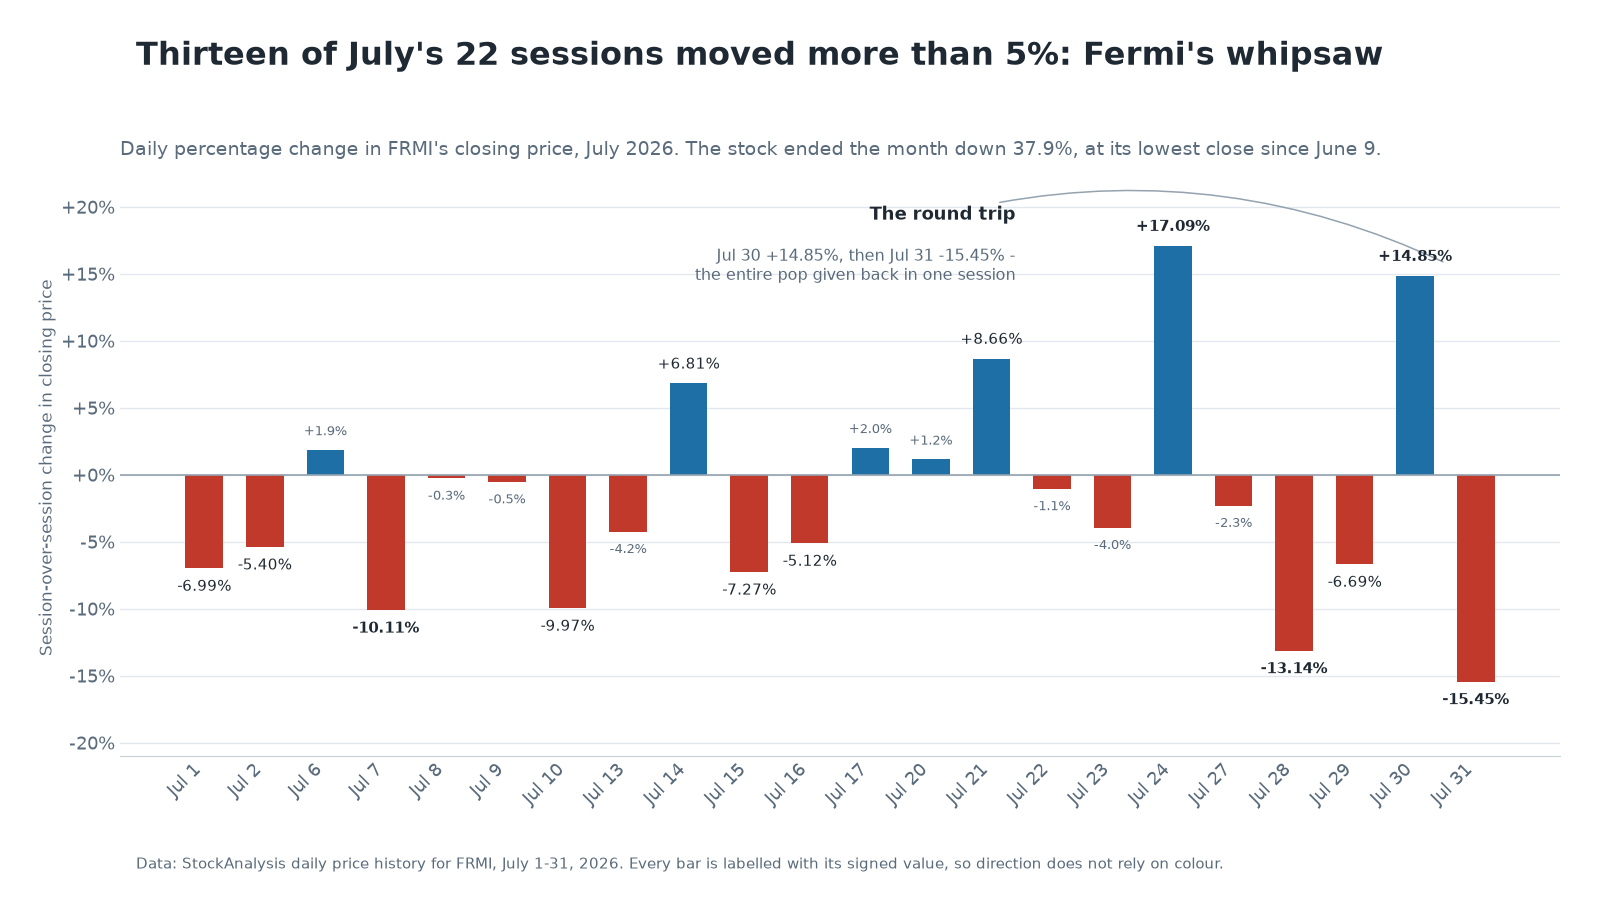
The real change happened in the days before, and it was a re-rating rather than an event. On July 27, Evercore ISI's Nicholas Amicucci maintained a Hold with an $11 target. The next day, Mizuho's Vikram Malhotra kept a Buy rating but cut his price target to $11 from $27 — a 59% reduction — and the stock fell 13.14% [5][12]. Those two marks now sit at the same number, and that number is less than half of Stifel's $17, itself cut from $29 on June 23 [5][13]. In five weeks the most engaged sell-side targets on this name went from the high twenties to eleven dollars — and that is only the latest leg of a de-rating that started in April, when UBS cut from $30 to $8 and Macquarie from $25 to $20 on the same day [23][24]. When an anchor moves that far that fast, rallies tend to meet holders marking to the new number rather than the old one.
The share count moved too, by two different mechanisms that are worth separating. On July 29, Fermi admitted 12,127,558 new shares to trading on the London Stock Exchange's Main Market, issued to settle advisory fees and vesting restricted stock units, taking shares in issue with voting rights to 640,467,348 [10]. That is immediate dilution of roughly 1.9%. It arrived three weeks after a convertible that is potential dilution rather than actual: priced at $375 million of 5.00% senior notes due 2031 and closed at $431.25 million once the initial purchasers exercised their $56.25 million option in full, for net proceeds of about $416.81 million [21]. Those notes convert near $9.52, and $34.5 million of the proceeds bought capped call transactions expected to reduce potential dilution, or offset certain cash payments, between the conversion price and a $14.64 cap; Fermi can settle conversions in cash, shares or a combination [21]. The distinction matters analytically, but the market has largely collapsed it, treating both as the same signal: a company with no revenue funding itself with paper. That was the reading that drove a comparable drop on July 10 [14].
Meanwhile the short base has been building. Short interest rose to 42.50 million shares from 33.86 million the prior month — a 25.5% increase — equal to 14.74% of a float of just 288.28 million shares, against 638.08 million shares outstanding [4]. Less than half the company's stock actually trades. StockAnalysis reports a short ratio of 1.99 days on its own methodology; measured against the 20-day average volume cited above, the same short interest works out to roughly 2.20 trading days [4]. On either figure the position is large relative to the float but quick to unwind — a combination that can amplify moves in both directions, though it does not by itself explain any particular session.
Valuation scenarios
Probabilities are the author's illustrative estimates, not forecasts, and each scenario is anchored to a published, dated target rather than to a model. They sum to 100%.
| Scenario | Price | Probability | Key drivers |
|---|---|---|---|
| Bull | ~$17 | 15% | Stifel's June 23 target holds: a permanent CEO is named, Project Matador reaches first power on schedule, and a hyperscaler tenant signs without a large equity issuance [13] |
| Base | ~$11 | 40% | The two freshest marks — Mizuho (Jul 28) and Evercore ISI (Jul 27) — prove right: development continues, milestones slip modestly, and further funding is raised on dilutive terms [5][12] |
| Bear | ~$4.50 | 45% | Below UBS's $6 and toward the $4.47 52-week low: tenant talks stall, the governance dispute drags, and the next raise comes at a discount [2][15] |
| Blended | ~$9.00 | 100% | About 58% above the $5.69 close — but see the sensitivity in the Analyst view |
Why it matters
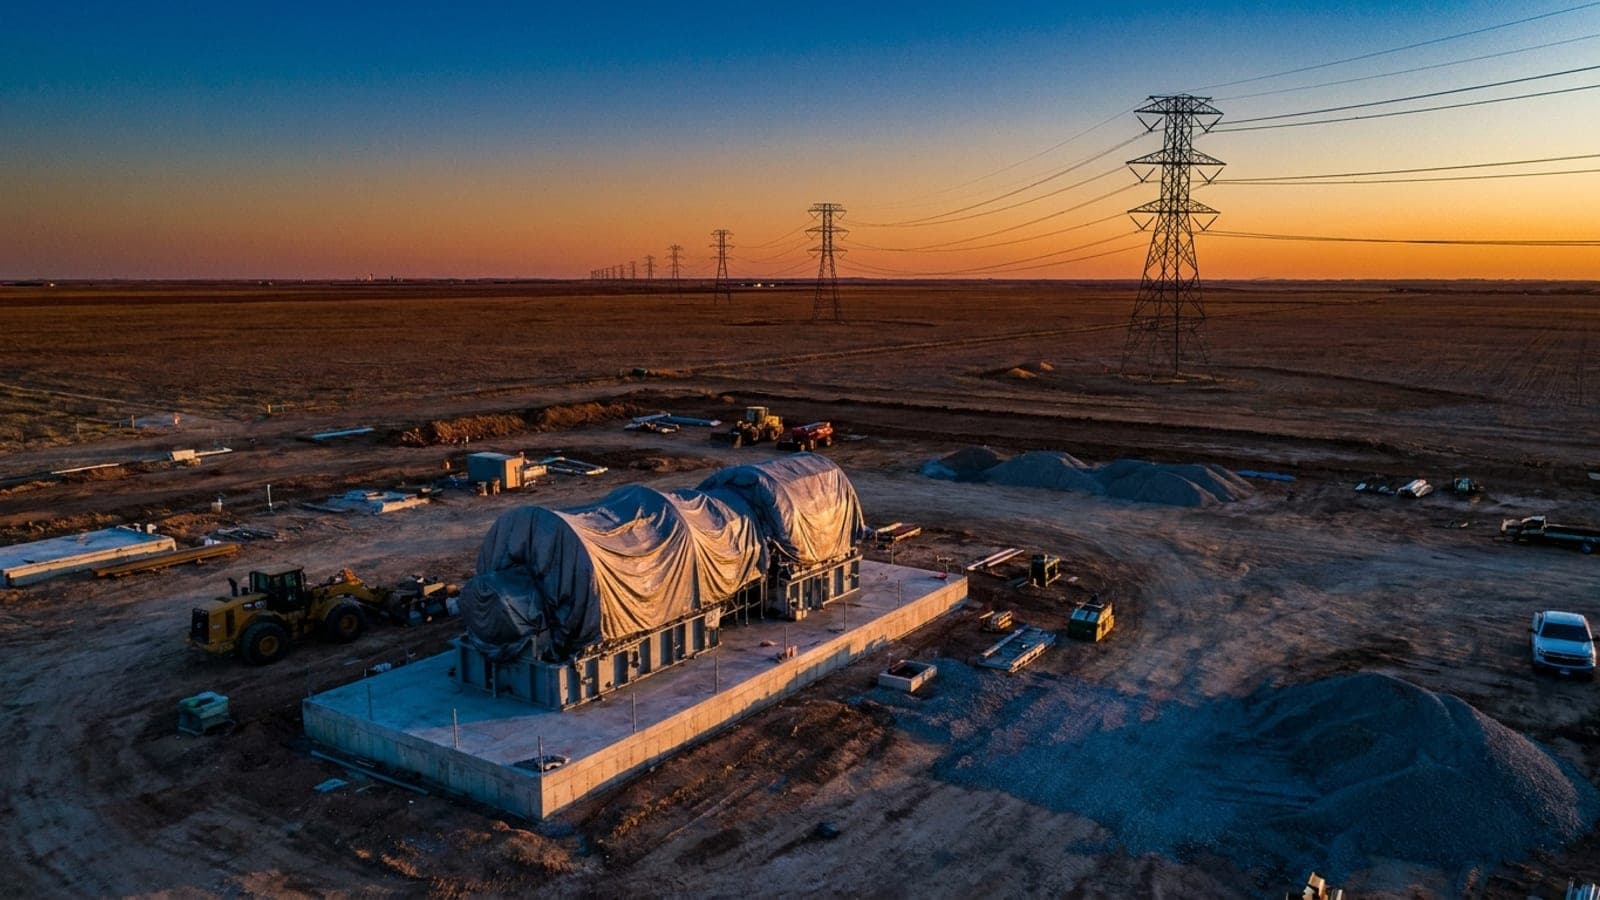
Fermi is the clearest live test of how public markets price pre-revenue infrastructure. Its plan — "Project Matador," a behind-the-meter campus in Amarillo, Texas stitching gas, nuclear, solar and storage together to feed hyperscale AI — is genuinely ambitious, and it is making visible physical progress: three Siemens Energy turbines with a combined 780 megawatts of capacity arrived at the Port of Houston in late July, and the company filled out its executive bench with a CFO, COO, chief commercial officer and general counsel on July 23 [16][17]. None of it produces revenue yet. A pre-revenue developer can still be valued — on projected cash flows, asset value, replacement cost, contracted capacity or milestone probabilities — and Fermi did report $1.47 billion of net property, plant and equipment inside $1.78 billion of total assets at March 31 [18]. But with no earnings to capitalise, the valuation rests unusually heavily on assumptions about future tenants and financing, which is why published price targets carry so much weight in the day-to-day tape, and why cutting those targets roughly 60% in five weeks moves the stock as much as it does.
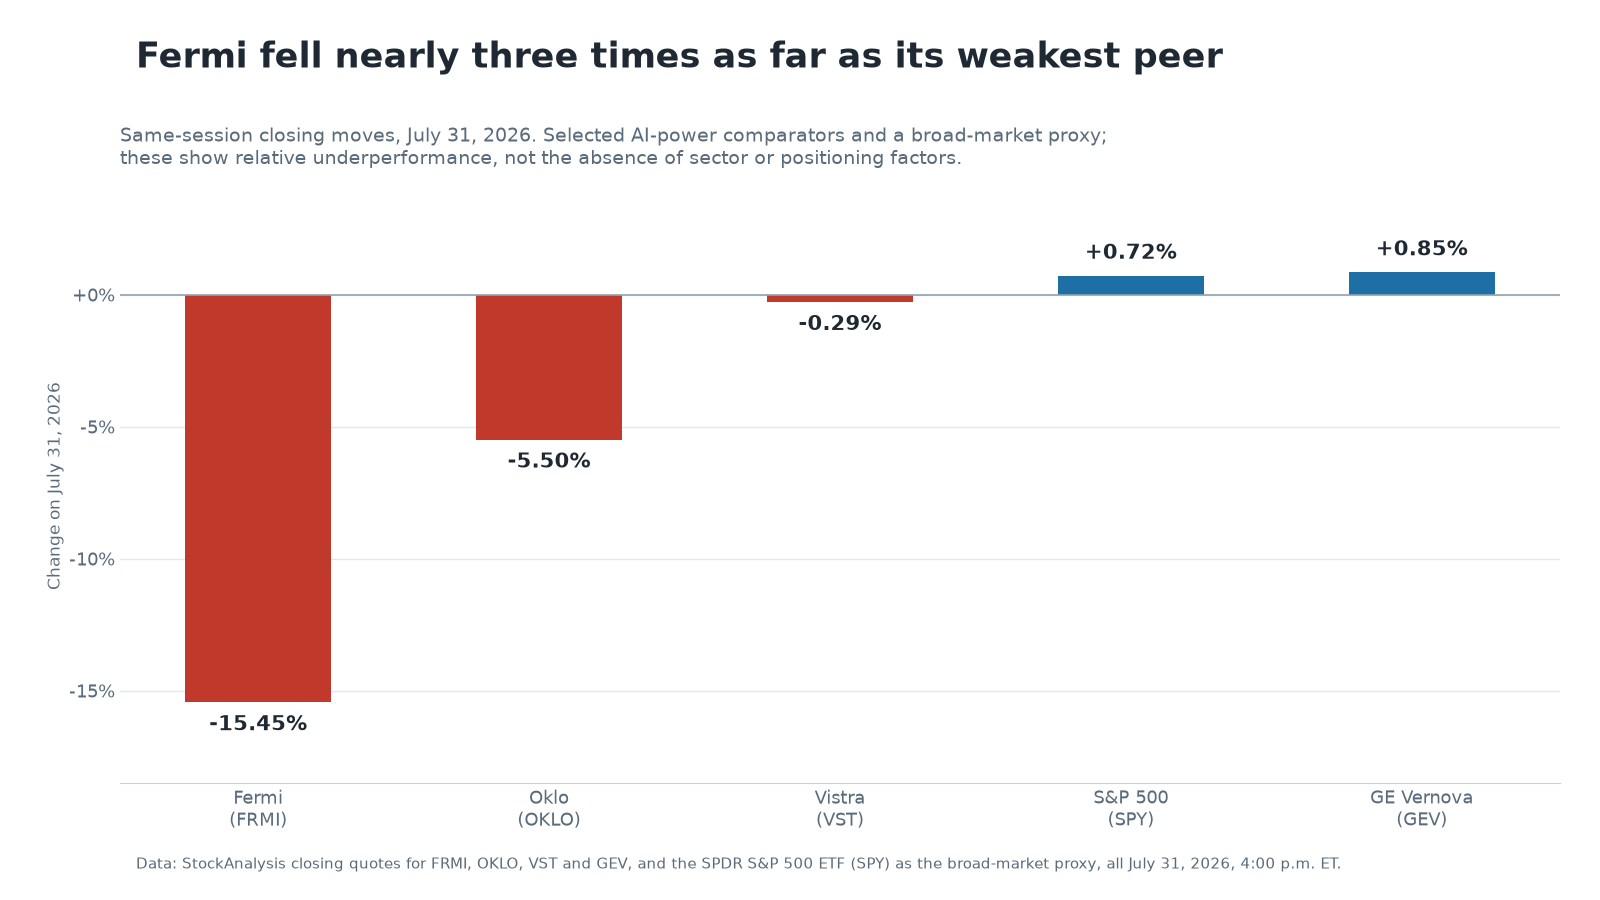
The contrast with peers is instructive. Vistra owns operating power plants and closed the session essentially flat; GE Vernova sells the equipment and closed higher. Oklo, the closest analogue as a pre-revenue developer, fell 5.50% — meaningfully more than the market, but a third of Fermi's decline. The market is not repudiating AI power. It is discriminating within it, and on this session it charged the steepest discount to the only one of these four that has yet to report revenue and that has raised capital twice in a month. We have documented both sides of that distinction elsewhere on this site: AST SpaceMobile, another pre-revenue builder, fell when its convertible financing was read as dilution rather than as runway, while TeraWulf and Hut 8 each rose on the announcement of a signed data-center lease.
What to watch
The Q2 report is the next real information, and the date is fixed: Fermi said on July 20 that it will release second-quarter results at 7:00 a.m. ET on Thursday, August 13, 2026, with a conference call at 9:00 a.m. ET [22]. Three things in it matter. First, cash: the last reported balance sheet, at March 31, showed $207.5 million of cash against $465.01 million of total debt on StockAnalysis's measure, $421.3 million of it long-term — all before the convertible added about $417 million net and before another quarter of burn [18][21]. Second, tenants — a signed, non-dilutive hyperscaler lease could materially change the thesis, and another quarter without one would strengthen the bear case. Third, the CEO seat, still unfilled after founder Toby Neugebauer's termination and the litigation that followed [14][19]. Beyond the print, watch whether Stifel's $17 survives contact with the quarter: if the last target above $11 comes down, the blended scenario value in the table above compresses toward the current price rather than away from it. Watch the short interest print too — a base of 42.5 million shares that can be covered in about two days of normal volume may continue contributing to volatility in both directions until the float or the story changes.
Why did FRMI stock drop on July 31, 2026?
Fermi fell 15.45% to $5.69 from a $6.73 prior close with no company-specific catalyst identified: no SEC filing, no press release and no analyst action was recorded for that session [1][2]. The decline reversed the entire 14.85% gain of July 30. The conditions around it were structural rather than event-driven — a price-target anchor cut roughly 60% in five weeks, most sharply by Mizuho's move to $11 from $27 on July 28; a 12.1 million-share London listing on July 29 that lifted the voting share count to 640,467,348; and short interest up 25.5% month over month to 42.5 million shares, or 14.74% of a 288.3 million-share float [4][5][10].
The July 31 move in numbers
| Measure | Value | As of / source |
|---|---|---|
| Prior close, Thu Jul 30 | $6.73 | Jul 30, 2026 close — StockAnalysis [3] |
| Close, Fri Jul 31 | $5.69 (−$1.04, −15.45%) | Jul 31, 2026, 4:00 p.m. ET — StockAnalysis [2] |
| Open / day's range | $6.63 / $5.68 – $6.65 | Jul 31, 2026 session — StockAnalysis [3] |
| Volume vs. average | 25.5M vs. 19.3M 20-day average (~1.32×) | Jul 31, 2026 — StockAnalysis [3][4] |
| 52-week range | $4.47 – $36.99 | Jul 31, 2026 — StockAnalysis [2] |
| Market capitalization | ~$3.63 billion | Jul 31, 2026 — StockAnalysis, computed on its 638.08M share count [2] |
| Shares outstanding (company) | 640,467,348 voting shares | Post-admission, Jul 29, 2026 — company notice [10] |
| Shares outstanding / float (vendor) | 638.08M / 288.28M (float 45.2% of shares out) | Jul 31, 2026 — StockAnalysis; trails the company count, see methodology [4] |
| Short interest | 42.50M shares (14.74% of float; 33.86M prior month) | Latest settlement — StockAnalysis [4] |
| 50-day / 200-day average | $7.08 / $10.34 | Jul 31, 2026 — StockAnalysis [4] |
| Next earnings | Aug 13, 2026, 7:00 a.m. ET (call 9:00 a.m. ET) | Company-confirmed, announced Jul 20, 2026 [22] |
How FRMI compared with its peers and the market
| Security | Jul 31, 2026 close | Change | Profile |
|---|---|---|---|
| Fermi (FRMI) | $5.69 | −15.45% | Pre-revenue developer [2] |
| Oklo (OKLO) | $38.83 | −5.50% | Pre-revenue advanced nuclear [6] |
| Vistra (VST) | $148.19 | −0.29% | Operating independent power producer [7] |
| GE Vernova (GEV) | $990.29 | +0.85% | Power equipment supplier [8] |
| S&P 500 (SPY) | 747.03 | +0.72% | Broad-market proxy [9] |
| Nasdaq 100 (QQQ) | 687.99 | +0.65% | Large-cap growth proxy [20] |
The analyst actions behind the de-rating
| Date | Firm / analyst | Action | Rating | Target |
|---|---|---|---|---|
| Jul 28, 2026 | Mizuho — Vikram Malhotra | Maintains, lowers target | Buy / Outperform | $27 → $11 [12] |
| Jul 27, 2026 | Evercore ISI — Nicholas Amicucci | Maintains | Hold / In-Line | $11 [5] |
| Jun 23, 2026 | Stifel Nicolaus — Stephen Gengaro | Reiterates, lowers target | Buy | $29 → $17 [13] |
| May 15, 2026 | Cantor Fitzgerald — Brett Knoblauch | Reiterates | Buy | $8 [5] |
| May 15, 2026 | Evercore ISI — Nicholas Amicucci | Downgrades, lowers target | Outperform → In-Line | $20 → $11 [12] |
| May 5, 2026 | UBS — John Hodulik | Downgrades | Buy → Hold / Neutral | $8 → $6 [15] |
| Apr 1, 2026 | UBS — John Hodulik | Maintains, lowers target | Buy | $30 → $8 [24] |
| Apr 1, 2026 | Macquarie — Paul Golding | Maintains, lowers target | Outperform | $25 → $20 [23] |
| Feb 24, 2026 | Berenberg Bank — Andrew Fisher | Maintains | Buy | $37 → $35 [5] |
| Feb 9, 2026 | Citizens JMP — Gregory P. Miller | Initiates | Buy | $30 [5] |
This list is compiled from StockAnalysis, MarketBeat and GuruFocus and is not guaranteed exhaustive — coverage of a recently listed company is inconsistent across vendors, and the Macquarie action above appears in none of the first two [5][12][23]. The direction, however, is unambiguous: every recorded target change since April has been downward. The published consensus — a Buy rating with a $19 average target across eight analysts — is arithmetically true and analytically misleading [5]. It is inflated by the February initiations at $30 and $35, set when the stock traded several times higher and never revisited since. The two targets set in the last week of July are both $11, and the lowest live mark is UBS's $6. Readers weighing the "+234% upside" implied by the headline average should note that no analyst has published a target above $17 since June 23.
Frequently asked questions
Why did Fermi (FRMI) stock fall 15% on July 31, 2026?
No company-specific catalyst was identified. Fermi filed nothing with the SEC on July 30 or 31, issued no press release, and no broker changed a rating or target that session. The stock opened at $6.63, barely below the $6.73 prior close, reached a high of only $6.65 and finished at $5.69 — a penny above its low — on about 1.32 times average volume, so essentially all of the decline occurred between the open and the close rather than as an overnight gap. The move reversed the entire 14.85% gain from July 30. The decline is consistent with continued repricing after a month of target cuts and financing activity, amplified by an unusually large short base: sell-side price targets had been cut roughly 60% in five weeks, 12.1 million new shares were admitted to trading in London on July 29, and short interest had risen 25.5% month over month. Those are conditions that make a session like this likely, not a proven cause of it.
Was the drop part of a wider AI-power or nuclear selloff?
It does not look like one, though selected comparators cannot rule out sector or positioning factors entirely. On the same session the SPDR S&P 500 ETF rose 0.72% and the Invesco QQQ Trust rose 0.65%. Among AI-power names, GE Vernova closed up 0.85% and Vistra was essentially flat at −0.29%. Oklo, the closest comparison as another pre-revenue developer, fell 5.50% — real weakness, but roughly a third of Fermi's decline. On these comparators the market looks to be discriminating within the theme rather than abandoning it, applying much the steepest discount to Fermi.
How volatile has FRMI stock been?
Exceptionally. Across July 2026's 22 trading sessions the average absolute daily move was 6.6%. Thirteen sessions moved more than 5% and five moved more than 10%, including +17.09% on July 24, −13.14% on July 28, +14.85% on July 30 and −15.45% on July 31. The stock ended the month down 37.9% from its June 30 close of $9.16, at $5.69 — its lowest close since June 9. A short base of 42.5 million shares that can be covered in about two days of normal volume, set against a float of only 288 million shares, is a condition that may amplify moves of this size in both directions.
How much has Fermi diluted shareholders?
There has been one direct share issuance and one potentially dilutive financing, and the distinction matters. On July 29 the company admitted 12,127,558 new shares to the London Stock Exchange's Main Market to settle advisory fees and vesting restricted stock units, taking shares in issue with voting rights to 640,467,348 — immediate dilution of about 1.9%. Three weeks earlier it had closed $431.25 million of 5.00% convertible senior notes due 2031, which represent potential future issuance rather than shares already outstanding; capped call transactions are expected to reduce that potential dilution, or offset certain cash payments, between the roughly $9.52 conversion price and a $14.64 cap, and Fermi may settle conversions in cash, shares or a combination. For a company with no revenue, the market has tended to read both as funding the gap with paper rather than with cash flow.
What is Fermi's Project Matador?
It is a behind-the-meter power campus under development in Amarillo, Texas, intended to combine natural gas, new nuclear, solar and storage to supply hyperscale AI data centers. Physical progress is visible — three Siemens Energy natural gas turbines with a combined 780 megawatts of capacity arrived at the Port of Houston in late July, and the company appointed a chief financial officer, chief operating officer, chief commercial officer and general counsel on July 23. None of it generates revenue yet. The company can still be valued — on projected cash flows, asset value, replacement cost or milestone probabilities, and it reported $1.47 billion of net property, plant and equipment within $1.78 billion of total assets at March 31 — but with no earnings to capitalise, the valuation leans heavily on assumptions about future tenants and financing.
What do analysts think FRMI is worth?
The headline consensus is a Buy with a $19 average target across eight analysts, implying more than 200% upside from $5.69 — but that average is stale. It is inflated by February initiations at $30 and $35 that have never been revisited. Every recorded target change since April has been downward: UBS cut from $30 to $8 and Macquarie from $25 to $20 on April 1, Stifel cut to $17 from $29 on June 23, Evercore ISI marked $11 on July 27, and Mizuho cut to $11 from $27 on July 28 while keeping a Buy. The lowest live target is UBS's $6, set at its May 5 downgrade. No analyst has published a target above $17 since June 23.
Is FRMI stock cheap after the July 2026 decline?
On the author's illustrative probability-weighted framework it screens as discounted, but the framework itself is fragile. Blending a bull case near $17 at 15%, a base near $11 at 40% and a bear near $4.50 at 45% gives roughly $9.00, about 58% above the $5.69 close. Every input is a sell-side target, and every recorded target change since April has been downward. Applying an illustrative downside sensitivity — $11 bull, $7 base, $3 bear — brings the blend to about $5.80, essentially the current price. The apparent upside therefore depends entirely on the de-rating having ended. These are illustrative estimates, not forecasts or advice.
When does Fermi next report earnings?
Fermi confirmed on July 20 that it will release second-quarter results at 7:00 a.m. ET on Thursday, August 13, 2026, followed by a conference call at 9:00 a.m. ET. Three disclosures matter most: the cash position, which stood at $207.5 million against $465.01 million of total debt at March 31 before the convertible added about $417 million net; whether any hyperscaler tenant has signed a lease, which could materially change the thesis; and whether a permanent chief executive has been named, the seat having been vacant since founder Toby Neugebauer's termination and the litigation that followed.