Stock Analysis
General Motors (GM) Falls ~8% Despite a Q3 Beat and a $20B Buyback
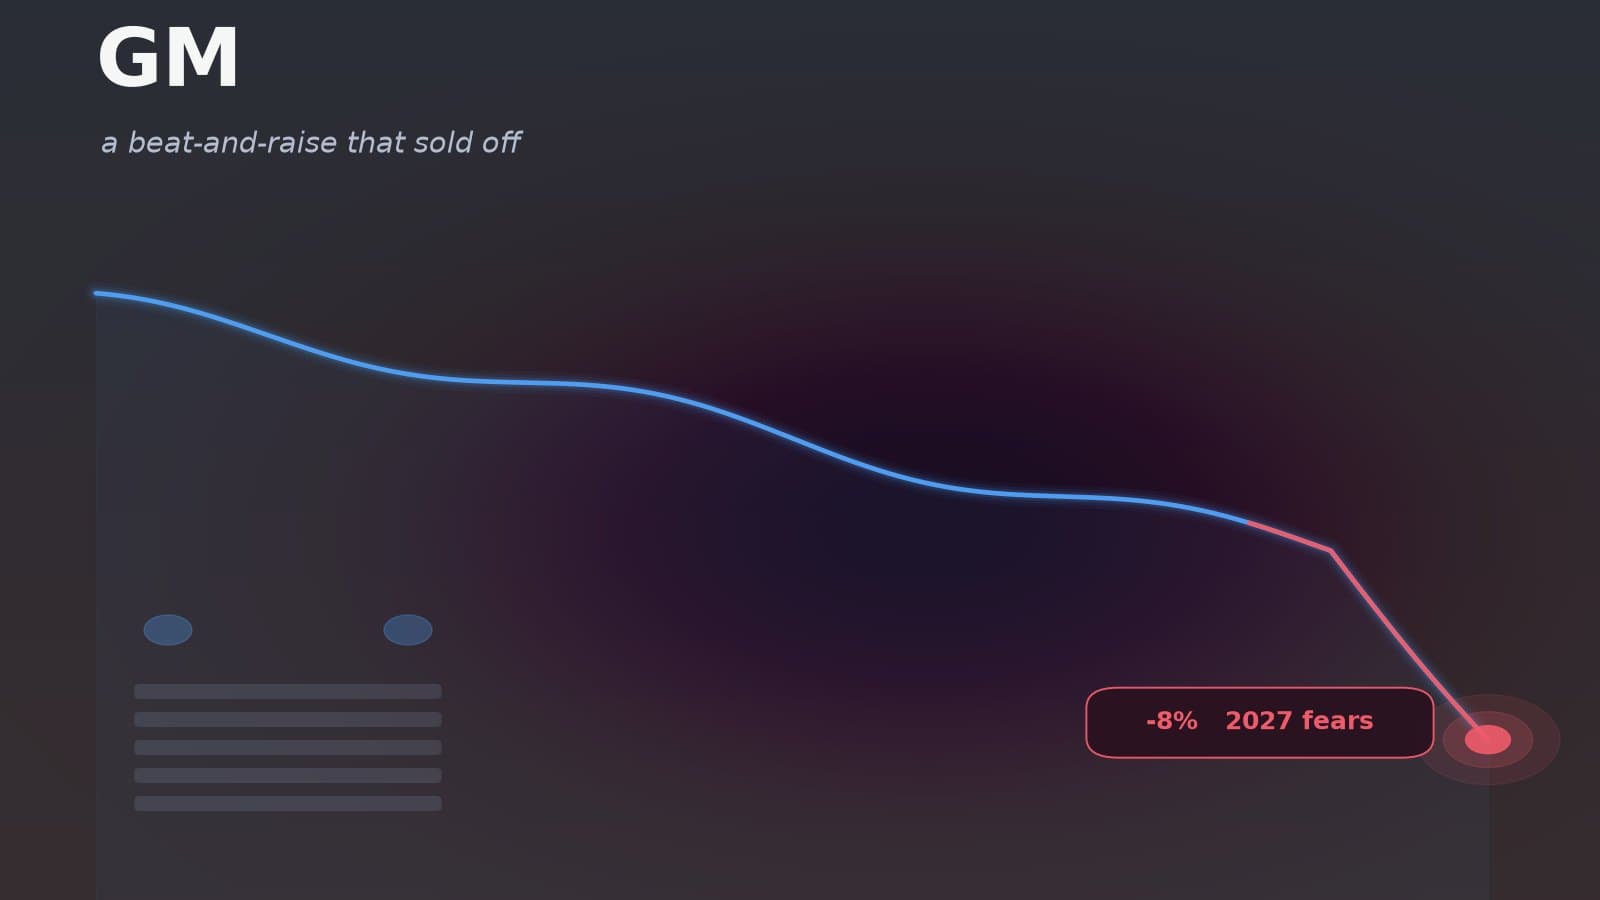
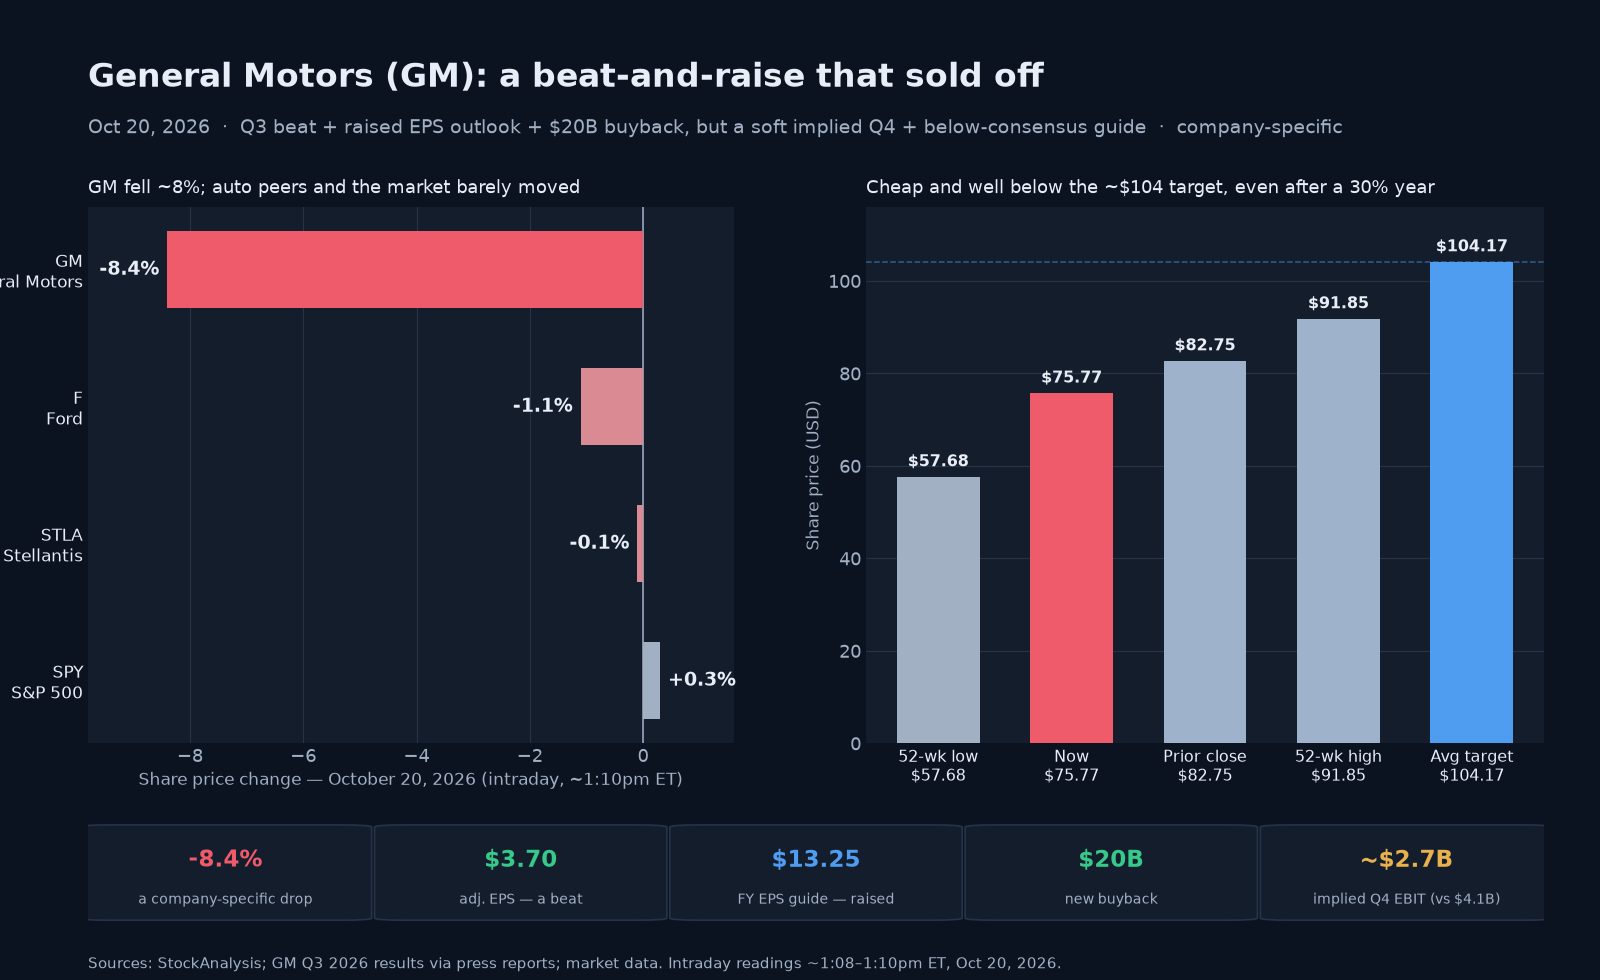
General Motors fell about 8% to roughly $75.77 on October 20 — a striking reaction, because GM beat on third-quarter earnings, raised its full-year profit outlook and announced a $20 billion buyback. Adjusted earnings of $3.70 a share topped estimates on revenue of about $50 billion, and GM lifted the midpoint of its full-year adjusted-EPS guidance to about $13.25 (from $13.00) and raised its free-cash-flow outlook. The stock fell anyway on what the guidance implied, not the quarter. The full-year outlook implies a softer fourth quarter — only about $2.7 billion of operating profit versus $4.1 billion in the third, as a Silverado/Sierra redesign temporarily cuts truck deliveries by roughly 35,000 units — the raised $13.25 EPS midpoint still landed just below the roughly $13.41 the Street expected, and management flagged about $2 billion of 2026 cost inflation plus a conditional scenario of more in 2027. Two things that look like culprits mostly were not: the 62% drop in EV sales was already known and reflects a distorted 2025 comparison, and tariff costs are now expected near the low end of an existing range. Crucially, GM did not cut its 2027 outlook — it still expects next year to improve if conditions hold. The move was clearly company-specific — Ford fell only about 1%, Stellantis was flat and the S&P 500 rose — so this was a repricing of GM's forward earnings, not an auto-sector sell-off. The valuation captures the tension: GM trades at barely five to six times the forward earnings it guides to, extraordinarily cheap, because the market prices automakers for the downturn, not the peak. A $20 billion buyback into that multiple is powerfully accretive if earnings hold — but whether they hold in 2027 is exactly the question. Analysts keep a Buy consensus and an average target near $104.
Why General Motors stock fell — a good quarter, a worried market
On Tuesday, October 20, 2026, General Motors (NYSE: GM) fell about 8%, trading near $75.77 intraday after gapping lower at the open and sliding to $75.73 [1]. The striking part is why: GM reported a third quarter that beat expectations, nudged up its full-year earnings and cash-flow outlook, and came with a headline-grabbing $20 billion buyback — and the stock dropped anyway. This was not a weak print met with a sell-off; it was a strong print met with worry about next year. The move was also clearly GM's own: fellow automakers barely budged and the broad market was higher, so this was company-specific, not a sector sell-off [5].
Start with what went right. Adjusted earnings came in at $3.70 a share, ahead of the roughly $3.63 analysts expected, on revenue of about $50 billion, also a beat [2]. GM then raised the midpoint of its full-year adjusted earnings guidance to about $13.25 a share (from $13.00), lifted its free-cash-flow outlook, and left the midpoint of its profit (EBIT) range unchanged while narrowing it — hardly the picture of a company in trouble [2]. And the capital return was enormous: a new $20 billion multi-year share-repurchase authorization, on top of a buyback program that has already shrunk the share count about 8% over the past year [3]. On the quarter alone, an 8% drop looks strange.
What actually spooked investors — the near-term setup, not the quarter
The sell-off was about what the guidance implied, not the quarter just reported. Three things did the damage. First and most concrete, an implied fourth-quarter slowdown: GM earned about $12.3 billion of adjusted operating profit (EBIT) in the first nine months, so its roughly $15 billion full-year midpoint implies only about $2.7 billion in the fourth quarter — well below the $4.1 billion it just posted in the third [2]. A big reason is a temporary pickup-truck production transition: GM expects roughly 35,000 fewer full-size truck deliveries year over year in the fourth quarter as it changes over to redesigned Silverado and Sierra models [2]. Second, expectations: GM raised its full-year adjusted-EPS midpoint to $13.25, but that still sits below the roughly $13.41 the Street had modeled — a raise relative to GM's own prior forecast, yet a miss relative to investors' [2]. Third, cost pressure: management flagged about $2 billion of commodity, logistics and other inflation in 2026 and sketched a conditional scenario of similar pressure in 2027 if commodity prices stay high — not a formal guidance cut, but enough to make investors cautious about next year's earnings growth [2].
Two things that look like culprits mostly were not. GM's electric-vehicle sales fell about 62% in the quarter, to roughly 25,200 units — but that figure was already public before the report and is distorted by a 2025 surge, when buyers rushed to use expiring federal incentives; GM has since matched EV production to demand and reiterated plans to cut EV losses by $1–$1.5 billion this year [2]. Tariffs, too, were not a fresh blow: GM's roughly $2.5–$3.5 billion cost estimate is an existing range, and management now expects to land near its low end [2]. Crucially, GM did not cut its 2027 outlook or warn that profits will fall; it still expects 2027 to improve, if demand holds and inflation moderates. The market simply doubted those conditions — and balked at a softer-looking fourth quarter — for a stock that had run up more than 40% into the report [1].
The valuation wrinkle
Here is the tension at the heart of the stock. On a trailing basis GM's price-to-earnings ratio is about 18, which looks ordinary, but that figure is on depressed reported earnings; on the forward earnings GM actually guides to — around $13 a share — the stock trades at barely five to six times earnings, with a price-to-sales ratio near 0.4 [3]. That is extraordinarily cheap, and it is the market telling you something: investors price automakers for the downturn, not the peak, because auto profits are cyclical and can fall hard when costs rise and pricing softens. A $20 billion buyback into a single-digit multiple is enormously accretive if earnings hold — but the whole debate is whether they will. The cheapness is not a free lunch; it is compensation for exactly the 2027 risks that sent the stock down today.
Why it matters
The episode is a textbook case of a market trading expectations, not results — and of how differently cyclical stocks are judged. GM did almost everything investors say they want: beat, raised guidance, returned capital. It fell anyway, because for a cyclical automaker the question is never "how good is this quarter?" but "how durable is the profit from here?" — and the guidance implied a softer fourth quarter and only a conditional improvement next year. The cross-section makes the point that this was GM-specific: Ford slipped only about 1%, Stellantis was flat, and the S&P 500 rose, so the market was not selling autos broadly, it was repricing GM's forward earnings [5]. It is also a reminder of the strange math of deep-value cyclicals: a stock at five-times forward earnings with a giant buyback is priced as though profits will fall, so it can drop on good news and still screen cheap. The resolution will come not from this quarter but from whether 2027 validates the caution — or proves it overdone.
The move, in one cross-section
The same-session tape shows a company-specific drop, not an auto-sector move [5]:
| Name (ticker) | Oct 20, 2026 (intraday) | Read-through |
|---|---|---|
| GM — General Motors | ≈−8.4% | The earnings name — down on 2027 cost, pricing and EV concerns despite a beat [1][2] |
| F — Ford | ≈−1.1% | Auto peer — only modestly lower; reports its own results separately [5] |
| STLA — Stellantis | ≈flat | Auto peer — little changed [5] |
| SPY — S&P 500 (ETF) | ≈+0.3% | Broad market higher — this was GM's own move [5] |
GM down about 8% while its peers and the market were flat-to-higher is the signature of a company-specific catalyst — here, cautious guidance for next year rather than a weak quarter [5].
What the Street thinks
Wall Street's longer-term stance did not change on the day. The consensus rating is a Buy, with an average 12-month target near $104 — roughly 37% above where the stock trades after the drop — inside a wide range from about $75 to $132 [6]. The ratings lean bullish, with a large majority of strong-buys against a handful of holds and a lone sell, reflecting a view that GM's cash generation, buybacks and cheap multiple outweigh the cyclical risks [6]. If anything, Tuesday's sell-off widened the gap to those targets — the familiar setup for a value stock, where the bulls point to the multiple and the capital return and the bears point to the cycle. The disagreement is not about whether GM is cheap; it is about whether cheap is justified. The 2027 outlook, not this quarter, will decide who is right.
What to watch
- The fourth quarter and the truck changeover. Whether the Silverado/Sierra production transition is as temporary as billed and the implied Q4 profit dip reverses in 2027 [2].
- 2027 guidance. When GM puts numbers on next year — the conditional "improvement if demand holds and inflation moderates" is the crux of the debate [2].
- Costs. Whether the roughly $2 billion of 2026 cost inflation eases or, as management's scenario warns, repeats in 2027 [2].
- The buyback pace. How fast GM executes the $20 billion authorization, which at a mid-single-digit multiple meaningfully lifts per-share earnings. Moves are tracked on the GM stock page [3].
Illustrative scenario sensitivity
Because the move is a reaction to the 2027 outlook rather than the quarter, the scenarios below are anchored to next year's earnings durability, the buyback and a cheap cyclical multiple rather than a single valuation [6]. They are a descriptive, author-weighted exercise over roughly the coming six-to-twelve months as 2027 guidance and the cycle clarify — not a forecast, target, recommendation, or trading advice — with subjective weights that sum to 100%.
| Scenario | Illustrative price | Weight | Key drivers |
|---|---|---|---|
| Q4 dip passes, 2027 improves | ~$96 | 30% | The fourth-quarter truck-transition dip proves temporary, 2027 improves as GM expects, and the $20 billion buyback shrinks the float, re-rating an ultra-cheap stock toward analyst targets [6]. |
| Cheap and range-bound | ~$78 | 40% | A softer fourth quarter and a flattish, cost-pressured 2027; the stock stays cheap and choppy, with buybacks providing support [1]. |
| Cost and cycle bite | ~$62 | 30% | 2027 earnings stall or fall as cost inflation repeats and demand softens, and the low multiple compresses further toward the lower end of the range [2]. |
Weighting those (0.30 × $96 + 0.40 × $78 + 0.30 × $62) gives an author-weighted reference value near $79 — an illustrative, probability-weighted scenario output mechanically derived from the weights above, and not a price target, fair-value estimate, or prediction — a touch above Tuesday's ~$75.77 intraday price [1][6]. The near-identity reflects a balanced but wide-dispersion setup: a deeply cheap automaker with a powerful buyback and a genuine 2027 question, where the outcome depends on the cycle and cost trajectory far more than on this one strong quarter. This is a scenario exercise and descriptive analysis of a news-driven move, not investment advice.
GM data snapshot — October 20, 2026
| Figure | Value | As-of / source |
|---|---|---|
| Intraday quote | ~$75.77 (−~8.4%) — an intraday reading (the session was open); gapped down and fell to $75.73 | Tue, Oct 20, 2026, ~1:09pm ET — StockAnalysis [1] |
| Prior close / open / range | $82.75 prior close; opened $77.22; day range $75.73–$78.97 | Oct 20, 2026 [1] |
| 52-week trend | 52-week range $57.68–$91.85; up ~30% over 52 weeks even after the drop (and more than 40% into the report at the prior close); beta ≈1.40 (cyclical); dividend yield ≈0.95% | As of Oct 20 [1] |
| Market cap | ≈$66.48B (≈877.5M shares; share count down ~8.5% YoY on buybacks) | Oct 20 — StockAnalysis [3] |
| Valuation | Trailing P/E ≈17.9× (on depressed GAAP EPS ≈$4.23); forward P/E ≈5–6× on ~$13.25 adjusted EPS; price-to-sales ≈0.4× — a deep-value cyclical | Oct 20 — StockAnalysis [3] |
| Q3 2026 results | Adjusted EPS $3.70 (beat ~$3.63; GAAP EPS $3.73); revenue ~$50.0B (beat); adjusted EBIT ~$4.1B (+22% YoY); a $20B buyback authorized (prior $6B completed); EV sales −62% to ~25,200 units (a known, incentive-distorted 2025 comp) | Oct 20 — company results [2] |
| Catalyst | Q3 earnings: a beat-and-raise that sold off. GM beat and raised its full-year adjusted-EPS midpoint to $13.25 (range $12.75–$13.75, from $13.00; still just below the ~$13.41 consensus), raised FCF guidance and added a $20B buyback — yet fell ~8% on a soft implied Q4 (~$2.7B EBIT vs $4.1B in Q3, as a pickup-truck redesign cuts deliveries) and conditional 2027 cost concerns. Not a guidance cut; EV/tariffs were known, not fresh | Oct 20, 2026 — company results via press reports [2] |
| Same-day cross-section | F −1.1%, STLA ≈flat (auto peers); SPY +0.3% — GM's drop was company-specific | Oct 20 intraday [5] |
| Analyst view | Consensus Buy, avg target ~$104.17 (low $75, high $132) — well above the price (~+37%); ratings ~13–15 Strong Buy / ~4–5 Hold / ~1 Sell | Oct 20, 2026 — StockAnalysis / analyst notes [6] |
General Motors (GM) stock FAQ
Why did General Motors (GM) stock fall on October 20, 2026?
GM fell about 8% to roughly $75.77 even though its third-quarter results were good — which is the striking part. The company beat on earnings (adjusted EPS of $3.70 versus about $3.63 expected) and revenue (about $50 billion), raised the midpoint of its full-year adjusted-EPS guidance to about $13.25 from $13.00, lifted its free-cash-flow outlook, and announced a $20 billion buyback. The stock fell anyway for three main reasons. First, the full-year guidance implies a softer fourth quarter: GM made about $12.3 billion of operating profit in nine months, so its roughly $15 billion full-year figure implies only about $2.7 billion in Q4 (versus $4.1 billion in Q3), partly because a Silverado/Sierra redesign temporarily cuts truck deliveries by roughly 35,000 units. Second, the raised $13.25 EPS midpoint still came in just below the roughly $13.41 analysts expected — a raise versus GM's own forecast, but a miss versus the Street. Third, management flagged about $2 billion of 2026 cost inflation and a conditional scenario of more in 2027. It was a strong quarter met with a cautious near-term setup — not a guidance cut, and not driven by the already-known 62% EV-sales drop.
Did GM actually cut its guidance?
No — that is a common misconception about this report. GM did not cut its outlook; it narrowed and slightly raised it. The company lifted the midpoint of its full-year adjusted-EPS guidance to about $13.25 from $13.00, raised its adjusted automotive free-cash-flow guidance, and kept the midpoint of its full-year profit (EBIT) range unchanged while narrowing the range. The nuances that fed the sell-off are that the raised $13.25 EPS midpoint still came in just below the roughly $13.41 the Street had modeled (so even the raise landed under the bar), and that the full-year figure implies a softer fourth quarter — only about $2.7 billion of operating profit versus $4.1 billion in the third, as a truck-redesign changeover temporarily cuts deliveries. So the decline reflected a cautious near-term setup and below-consensus expectations, not an actual reduction in this year's guidance.
Why is GM's stock so cheap at five to six times earnings?
GM trades at roughly five to six times the forward earnings it guides to (around $13 a share) and about 0.4 times sales — extraordinarily cheap on the surface. But that low multiple is normal for an automaker, not necessarily a bargain, because auto profits are highly cyclical: they can fall sharply when costs rise and vehicle pricing softens, so the market prices the stock for a downturn rather than a peak. The trailing price-to-earnings ratio near 18 looks more ordinary, but it is calculated on depressed reported earnings; the forward multiple on guided earnings is the cleaner gauge, and it is very low. The cheapness is essentially compensation for the risk that 2027 earnings decline — which is exactly the concern that drove the stock down. A big buyback into such a low multiple is powerfully accretive if earnings hold, but that is the open question.
How big is GM's buyback and does it matter?
GM announced a new $20 billion multi-year share-repurchase authorization, on top of a buyback program that has already reduced its share count by roughly 8% over the past year. At GM's valuation — barely five to six times forward earnings — buybacks are unusually powerful: retiring stock at a low multiple meaningfully raises earnings per share even if total profit is only flat, and it provides support under the share price. That is a central part of the bull case. The important caveat is that a buyback cannot offset a genuine decline in earnings; if 2027 profit falls because of costs, pricing or EV losses, repurchases soften the blow but do not reverse it. So the buyback is a real positive and a key swing factor, but it works best in the scenario where GM's earnings prove more durable than the market currently fears.
How did GM's results compare with other automakers that day?
The move was specific to GM, not a broad auto sell-off. On the same day, Ford fell only about 1%, Stellantis was roughly flat, and the S&P 500 was actually higher. GM's roughly 8% drop stood out sharply against that backdrop, which is the classic signature of a company-specific catalyst — here, its own earnings report and the cautious read on 2027 — rather than a sector-wide move. That isolation matters for interpretation: it tells you the market was repricing GM's forward earnings in particular, not turning negative on automakers or the market generally. Ford reports its own results separately, so investors will get a cleaner read on whether GM's cost, pricing and EV concerns are company-specific or industry-wide when peers report.
What should investors watch next for General Motors?
Four things. First, the fourth quarter and the truck changeover — whether the Silverado/Sierra production transition is as temporary as billed and the implied Q4 profit dip (about $2.7 billion of EBIT versus $4.1 billion in Q3) reverses. Second, GM's 2027 guidance when it puts numbers on next year; management expects improvement only conditionally, if demand holds and inflation moderates, which is the crux of the debate. Third, costs: whether the roughly $2 billion of 2026 cost inflation eases or, as management's scenario warns, repeats in 2027. Fourth, the pace of the $20 billion buyback, which at a mid-single-digit forward multiple can lift per-share earnings substantially. Because GM is a deep-value cyclical, the stock is likely to stay sensitive to any signal about the durability of its profits — the quarter itself was strong, so the debate is about what comes next.