Stock Analysis
QXO (QXO) Jumps ~20% as the TopBuild Deal Lifts Q3 Sales 79%
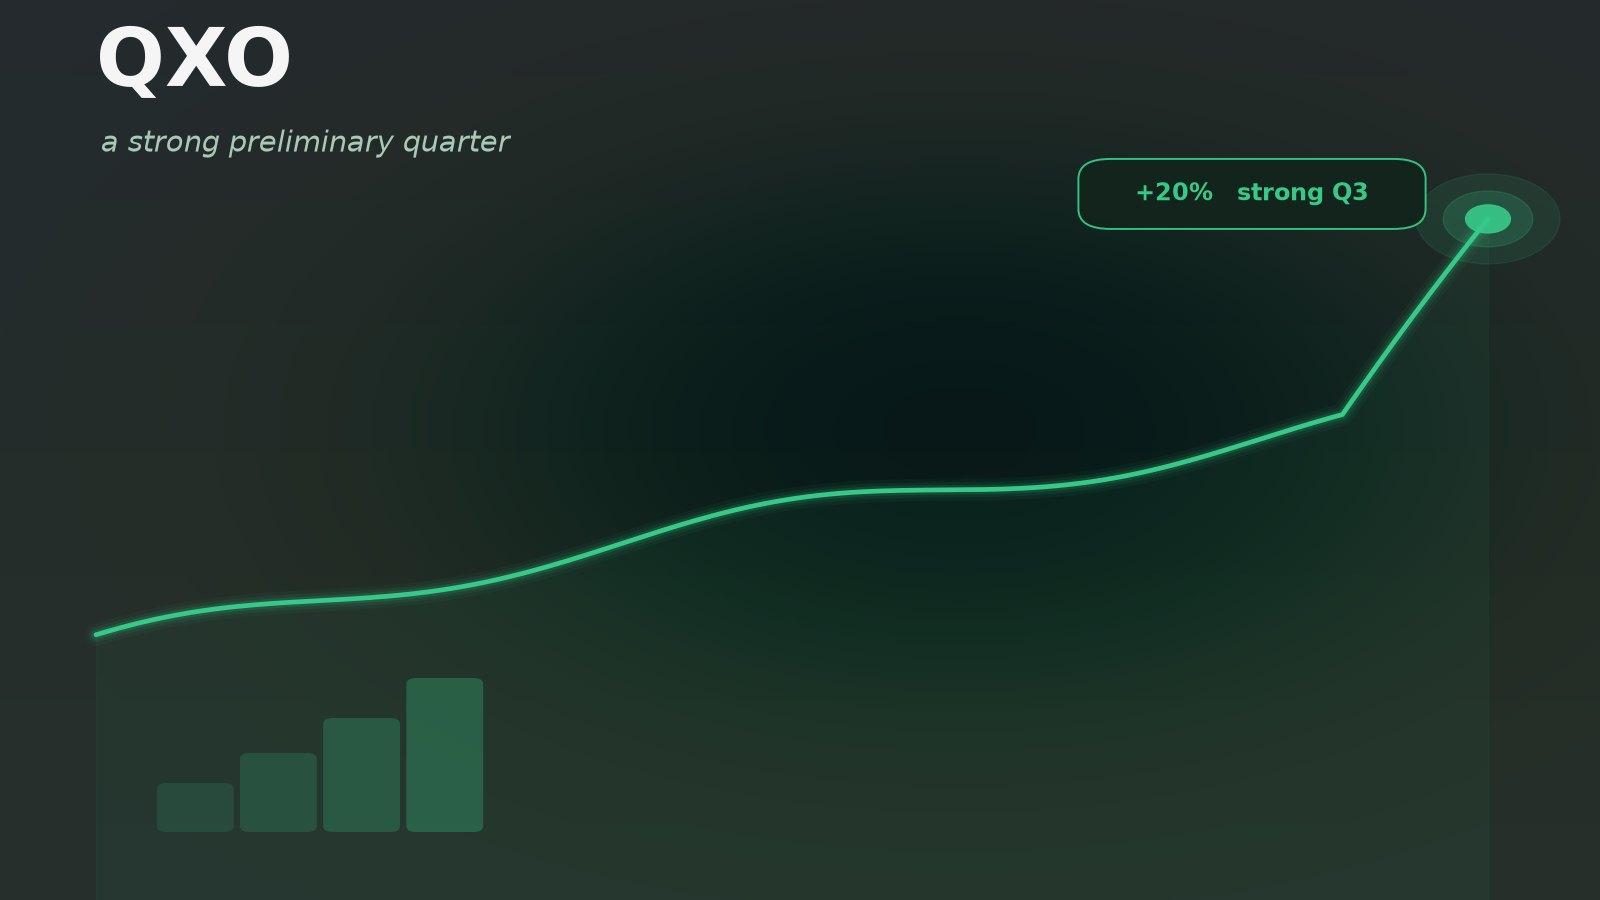
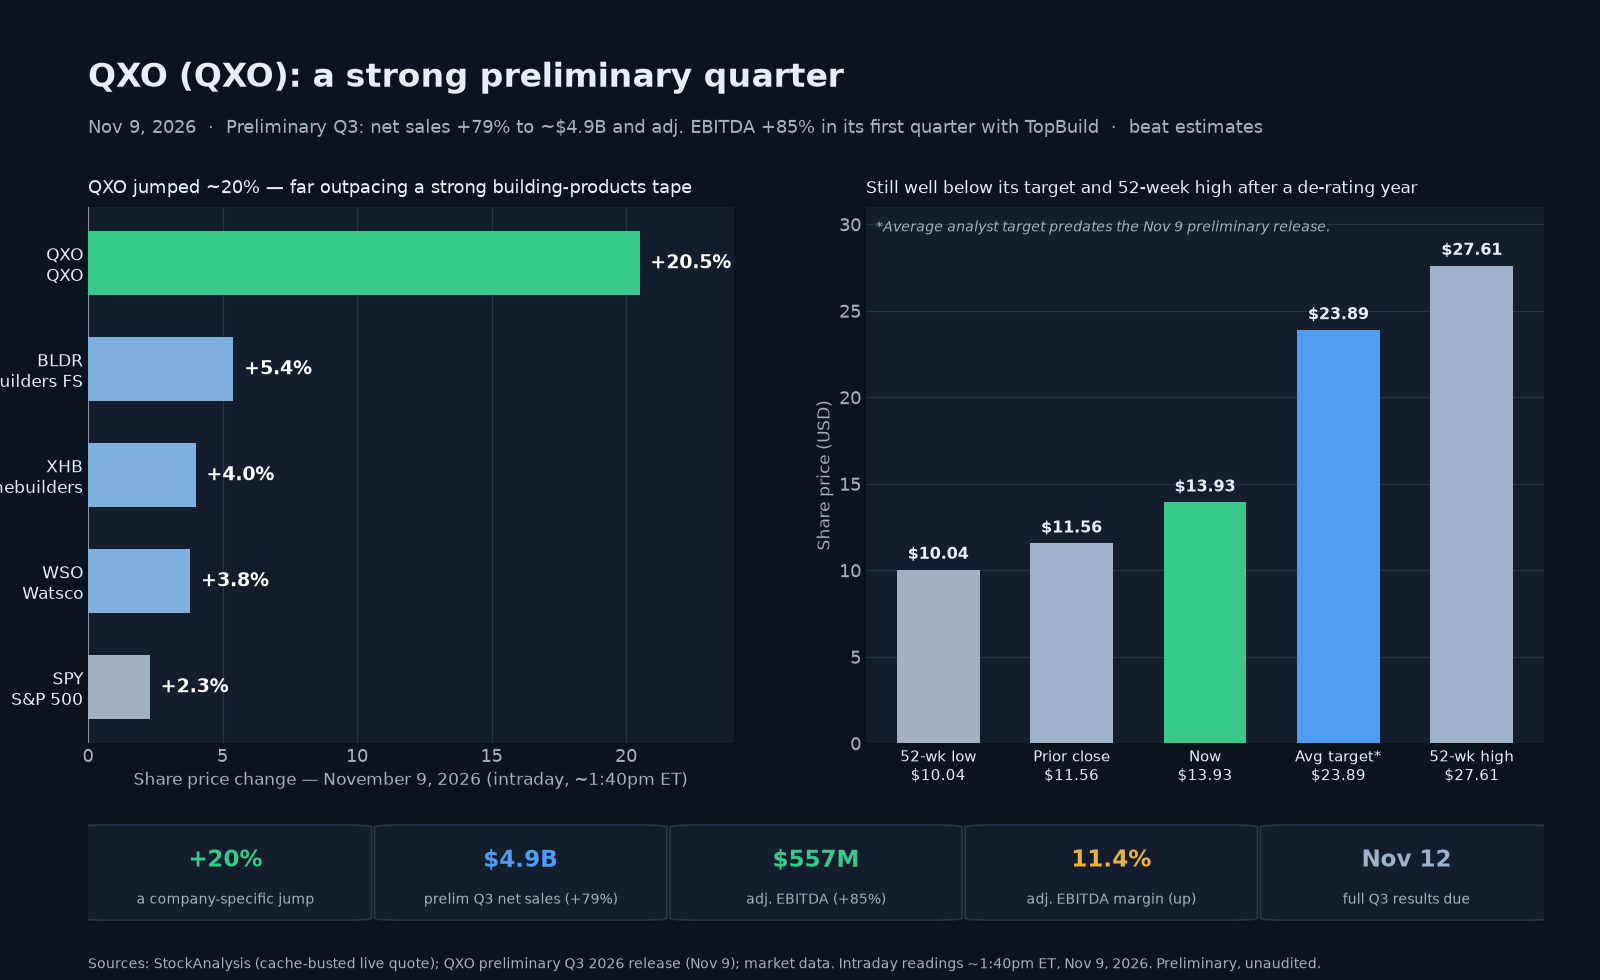
QXO jumped about 20% to roughly $13.90 on November 9 after the building-products distributor released preliminary third-quarter results ahead of its full report. Net sales rose about 79% to $4.9 billion and adjusted EBITDA rose about 85% to $557 million, with the margin edging up to 11.4% — modestly ahead of the roughly $4.85 billion revenue consensus. QXO is the building-products roll-up of Brad Jacobs, who previously built XPO Logistics and United Rentals, and this was its first full quarter including TopBuild, the insulation installer and distributor it bought on July 1 for about $15 billion. So the 79% sales jump is mostly acquired, not organic — the scale of acquisitions landing in the numbers for the first time, though management pointed to improving organic sales trends and firmer pricing on a separate call. What the market rewarded was the margin signal — EBITDA growing faster than sales as a giant deal is absorbed — the clearest early sign the integration is working, against a stock that had fallen roughly 19% over the past year. The caveats are important: these are preliminary, unaudited figures (full results come November 12); the growth is acquisition-driven and the release gave no consolidated organic rate; QXO is still a GAAP loss-maker because of acquisition amortization, interest and deal costs; and the expansion is financed with heavy share issuance (the count is up about 60% in a year) and roughly $7 billion of debt. The move was company-specific — QXO far outpaced building-products peers that rose only mid-single digits. Analysts keep a Strong Buy with an average target near $24, though several had trimmed targets into the quarter. The real verdict waits for the full results.
Why QXO stock jumped — a strong preliminary quarter
On Monday, November 9, 2026, QXO, Inc. (NYSE: QXO) jumped about 20%, trading near $13.90 intraday after the building-products distributor released preliminary third-quarter results ahead of its full report [1]. The headline numbers were big: net sales of about $4.9 billion, up 79% from a year earlier, and adjusted EBITDA of about $557 million, up 85%, with the margin edging up to 11.4% [2]. The beat versus consensus was actually modest — revenue was only about 1% above the roughly $4.85 billion expected — but for shares that had fallen roughly 19% over the past year, the big year-over-year figures, a firmer margin and encouraging commentary were enough to spark a sharp relief rally.
The important context is what QXO is. It is the building-products roll-up of Brad Jacobs — the serial consolidator who previously built XPO Logistics and United Rentals — assembled to buy and integrate the fragmented industry that supplies roofing, insulation and other building materials [2]. This was its first full quarter including TopBuild, the insulation installer and distributor it bought on July 1, 2026 for about $15 billion — its largest deal to date, financed with roughly $6.4 billion of cash plus about 312.5 million newly issued shares and new debt — on top of Kodiak Building Partners earlier in the year [2]. (The TopBuild deal also makes QXO a distributor and installer of building products, not a pure distributor.) So the eye-catching 79% sales jump is mostly acquired, not organic — it is the scale of those deals landing in the results for the first time, though management did point to improving underlying sales trends and firmer pricing on a separate call [2]. What the market rewarded was evidence that the pieces are fitting together profitably — adjusted EBITDA growing even faster than sales, and the margin edging up (about 30 basis points) rather than compressing as the deals are absorbed.
What actually drove the move — scale and margins, not just organic growth
Three things explain the reaction. First, the margin signal: adjusted EBITDA up 85% against sales up 79%, with the margin rising to 11.4% from 11.1%, is the clearest early sign that QXO is integrating its acquisitions without the dis-synergies that often plague roll-ups [2]. For a company whose entire thesis is "buy fragmented distributors and run them better," margin direction matters more than the top-line number, which acquisitions guarantee will be large. Second, expectations versus a beaten-down stock: QXO's shares had fallen through the year, trading well below their $27.61 52-week high, and analysts had been trimming their price targets into the quarter, so a clean preliminary beat landed against low near-term sentiment and snapped the stock higher [1][6]. Third, the early release itself: putting preliminary numbers out three days before the full November 12 report, without explanation, signaled confidence and pulled the positive surprise forward [2].
But the quarter has to be read with its caveats in view. These are preliminary, unaudited figures; the full results, with the detail that matters — organic growth, cash flow, segment margins and guidance — come on November 12 [2]. The growth is acquisition-driven: QXO's release did not give a consolidated organic growth rate — the 79% jump simply reflects Kodiak and TopBuild being in this year's numbers but not last year's — though on a separate call management said organic daily-sales trends improved for a second straight quarter and companywide pricing rose about 2.2% year over year [2]. And QXO is still a GAAP loss-maker — it reported a net loss of about $123 million — because the roll-up carries heavy costs: roughly $288 million of acquisition-related amortization, about $163 million of net interest on the debt that funds the deals, and $40 million of transaction costs in the quarter alone [2]. Adjusted EBITDA is the operating metric here, but the gap between it and GAAP earnings is the price of the strategy. Two clarifications worth making. A widely circulated $4 billion asset sale and buyback reported around the same time belongs to a different company (the power producer NRG), not QXO — QXO's catalyst was purely the preliminary quarter [2]. And separately that day, Brad Jacobs disclosed a roughly $1 billion personal investment in the land company CKX Lands (becoming its chairman and chief executive while keeping his QXO roles) — another separate matter, not a QXO deal [2].
The valuation question
QXO is valued on scale and potential, not current earnings — it loses money on a GAAP basis, so there is no meaningful price-to-earnings ratio [3]. After the jump its market value is about $14.5 billion, with an enterprise value near $18.7 billion once roughly $4.3 billion of net debt is added [3]. On trailing revenue the price-to-sales ratio is about 1.4, but that understates the transformation: with the third quarter alone at $4.9 billion, QXO's revenue run-rate is now roughly $20 billion, which puts the stock under one times forward sales [3]. The catch is how that scale was financed — the share count has risen about 60% over the past year as QXO issued stock (including preferred and convertible securities) to fund acquisitions, and it carries about $7 billion of gross debt [3]. So the roll-up has created a large revenue base cheaply on a sales multiple, but the dilution and leverage are real, and the equity value ultimately depends on turning that acquired scale into durable free cash flow — which the preliminary quarter hints at but does not yet prove.
Why it matters
QXO is the most visible live test of the "serial-acquirer compounder" model in a traditional, cyclical industry. Brad Jacobs has done this twice before, and investors are paying up front for the pattern to repeat — which is why a preliminary beat moved the stock 20% while the broad building-products group rose only mid-single digits [5]. The episode is a useful lesson in how roll-ups are judged: the top-line growth is almost a formality once you have bought enough revenue, so the market fixates on the margin and integration signals, which is exactly what this quarter delivered. But it also shows the limits of a preliminary release — the figures that decide whether a roll-up is creating or destroying value (organic growth, free cash flow, leverage) were not in it, so the real verdict waits for November 12. For a company financing its expansion with heavy share issuance and debt in a soft construction backdrop, the margin proof-point is encouraging, but the gap between adjusted EBITDA and GAAP losses is the reminder that scale alone is not value. How QXO converts this acquired size into cash, and whether organic demand holds, will decide whether today's enthusiasm is an inflection or a relief bounce.
The move, in one cross-section
The same-session tape shows a company-specific jump that far outpaced a strong building-products group [5]:
| Name (ticker) | Nov 9, 2026 (intraday) | Read-through |
|---|---|---|
| QXO — QXO | ≈+20% | The earnings name — jumped on a preliminary Q3 beat (sales +79%, EBITDA +85%) in its first quarter with TopBuild [1][2] |
| BLDR — Builders FirstSource | ≈+5.4% | Building-products peer — up solidly on a risk-on day, but a quarter of QXO's move [5] |
| XHB — Homebuilders ETF | ≈+4.0% | The housing/building complex was broadly higher [5] |
| WSO — Watsco | ≈+3.8% | Distribution peer — modest gain; no company-specific news [5] |
| SPY — S&P 500 (ETF) | ≈+2.3% | Broad market higher on a risk-on day — QXO's move was far larger [5] |
QXO up about 20% while its building-products peers rose mid-single digits on a strong tape is the signature of a company-specific catalyst — here its own preliminary quarter — amplified by a risk-on day for the group [5].
What the Street thinks
Wall Street was already bullish on the strategy. The consensus rating is a Strong Buy from about 19 analysts, with an average 12-month target near $24 — roughly 70% above the post-jump price — inside a wide range from about $14 to $50 [6]. But those targets predate the preliminary release, and several firms had been cutting their targets through October as the shares fell (for example to the high teens and low twenties), so the near-term mood had cooled even as the long-term ratings stayed positive [6]. The preliminary beat pushes against that recent negativity, and the full November 12 results will likely drive the next round of revisions. The disagreement is not really about whether QXO can build scale — it clearly can — but about how profitably and how much dilution it takes, which is why the targets span such a wide range and why the full report matters more than the preliminary one [6].
What to watch
- The full results on November 12. Organic growth, free cash flow, segment margins and any guidance — the figures the preliminary release left out and the ones that actually judge a roll-up [2].
- Organic versus acquired growth. Whether QXO is growing the businesses it buys, not just adding them — the key distinction between value creation and financial engineering [2].
- Leverage and dilution. How QXO manages roughly $7 billion of debt and whether share issuance slows as the integration phase matures [3].
- The construction backdrop. Demand for roofing, insulation and building products as housing and non-residential activity shift. Moves are tracked on the QXO stock page [5].
Illustrative scenario sensitivity
Because the jump is a reaction to integration and margin proof rather than a fully reported quarter, the scenarios below are anchored to how the roll-up converts acquired scale into organic growth and cash rather than to a single valuation [6]. They are a descriptive, author-weighted exercise over roughly the coming six-to-twelve months as the full results and de-leveraging path clarify — not a forecast, target, recommendation, or trading advice — with subjective weights that sum to 100%.
| Scenario | Illustrative price | Weight | Key drivers |
|---|---|---|---|
| Integration compounds | ~$20 | 30% | The full results confirm the margin story with real organic growth, QXO begins de-leveraging, and the market re-rates the compounder toward analysts' median target [6]. |
| Scale is real, prove the rest | ~$14 | 45% | The acquired scale and margins hold, but organic growth is muted and leverage stays high; the stock is cheap on run-rate sales and range-bound near current levels while the market waits for the full picture [1]. |
| Roll-up strain | ~$10.50 | 25% | Soft construction demand, integration friction, heavy debt and further dilution weigh, and the stock drifts back toward its 52-week low [3]. |
Weighting those (0.30 × $20 + 0.45 × $14 + 0.25 × $10.50) gives an author-weighted reference value near $15 — an illustrative, probability-weighted scenario output mechanically derived from the weights above, and not a price target, fair-value estimate, or prediction — a touch above Monday's ~$13.90 intraday price [1][6]. The modest premium reflects a genuine margin proof-point and analysts' well-above-price targets, offset by acquisition-driven (not organic) growth, GAAP losses and real leverage and dilution; the wide dispersion between the scenarios is the honest signal that the outcome hinges on the full results and the quality of the growth far more than on this preliminary beat. This is a scenario exercise and descriptive analysis of a news-driven move, not investment advice.
QXO data snapshot — November 9, 2026
| Figure | Value | As-of / source |
|---|---|---|
| Intraday quote | ~$13.90 (+~20%) — an intraday reading (the session was open); day range $12.40–$13.97 | Mon, Nov 9, 2026, ~1:42pm ET — StockAnalysis [1] |
| Prior close / open | $11.56 prior close; opened $12.65 | Nov 9, 2026 [1] |
| 52-week trend | 52-week range $10.04–$27.61; down ~19% over 52 weeks into the print (~50% below the high); below its 200-day average (~$16.93); beta ≈2.36 (high) | As of Nov 9 [1] |
| Market cap | ≈$14.45B (≈1.04B shares, up ~61% YoY on acquisition-related issuance); enterprise value ≈$18.72B; ~$2.77B cash vs ~$7.04B debt (net debt ≈$4.26B) | Nov 9 — StockAnalysis [3] |
| Valuation | GAAP loss-making (no P/E; net income ttm ≈−$656M, EPS ttm ≈−$0.89); price-to-sales ≈1.4× on ~$9.9B trailing revenue, or ≈0.7× on a ~$20B run-rate; gross margin ≈24.5% | Nov 9 — StockAnalysis [3] |
| Preliminary Q3 2026 | Net sales ~$4.9B (+79% from $2.73B; beat ~$4.85B est); adjusted EBITDA ~$557M (+85% from $301M; margin 11.4% vs 11.1%); GAAP net loss ~$123M (narrowed from $139M) — preliminary and unaudited; full results due Nov 12 | Nov 9 — QXO preliminary Q3 2026 release [2] |
| Catalyst | Early release of preliminary Q3. The beat was acquisition-driven (first full quarter with TopBuild, bought Jul 1 for ~$15B, plus Kodiak from Apr 1 — neither in the year-ago base; the release gave no consolidated organic rate, though management cited improving organic trends and ~2.2% pricing on a call), and the market cheered the margin signal (EBITDA +85% vs sales +79%). Note: the "$4B LS Power asset sale / $3B buyback" in some press is NRG's deal, not QXO's | Nov 9, 2026 — company release [2] |
| Same-day cross-section | BLDR +5.4%, WSO +3.8%, XHB +4.0% (building-products complex); SPY +2.3% (market) — QXO's ~20% far outpaced peers on a risk-on day | Nov 9 intraday [5] |
| Analyst view | Consensus Strong Buy, avg target ~$24 (low ~$14, median ~$21, high ~$50) from ~19 analysts — but these predate the Nov 9 release, and several firms trimmed targets through October as the shares fell | Nov 9, 2026 — StockAnalysis / analyst notes [6] |
QXO (QXO) stock FAQ
Why did QXO (QXO) stock jump on November 9, 2026?
QXO jumped about 20% to roughly $13.90 after the building-products distributor released preliminary third-quarter results ahead of its full report. Net sales rose about 79% to $4.9 billion and adjusted EBITDA rose about 85% to $557 million, with the margin edging up to 11.4% — modestly ahead of the roughly $4.85 billion revenue consensus. The move was less about the raw sales number, which acquisitions guarantee will be large, and more about the margin signal: EBITDA growing even faster than sales suggested QXO is integrating its acquisitions profitably rather than destroying value. Because the shares had fallen roughly 19% over the past year and analysts had been trimming their targets, a clean preliminary beat landed against low near-term expectations and sparked a sharp relief rally. These are preliminary, unaudited figures; QXO's full third-quarter results are due November 12.
What is QXO and who is Brad Jacobs?
QXO is a building-products distribution company being assembled as a roll-up — a business that grows mainly by acquiring and integrating other companies in a fragmented industry. It is the latest venture of Brad Jacobs, the executive who previously built XPO Logistics in freight transportation and United Rentals in equipment rental, both through aggressive acquisition strategies. With QXO, Jacobs is applying the same playbook to the fragmented market that distributes roofing, insulation and other building materials. The company has acquired Beacon Roofing, Kodiak Building Partners and, most significantly, TopBuild — an insulation installer and distributor it bought on July 1, 2026. Investors are essentially paying in advance for Jacobs to repeat a pattern he has executed twice before, which is why QXO's stock reacts strongly to evidence that the integration is working.
Is QXO's 79% sales growth real, organic growth?
No — and this is the most important nuance. The roughly 79% jump in net sales is almost entirely acquisition-driven, not organic. QXO's third-quarter results include TopBuild (acquired July 1, 2026) and Kodiak Building Partners (acquired earlier in the year), neither of which was in the year-ago period, so adding those businesses mechanically produces a large year-over-year increase. QXO's preliminary release did not give a consolidated organic growth rate, though on a separate call management said organic daily-sales trends improved for a second straight quarter and companywide pricing firmed (up about 2.2% year over year). That matters because for a roll-up, buying revenue is the easy part; the real test of whether the strategy creates value is whether the acquired businesses grow on their own and convert sales into cash. The full organic-growth and free-cash-flow detail is expected with the complete results on November 12. Until then, the 79% headline should be read as scale added, with the organic picture still only partly disclosed.
Is QXO profitable?
Not on a GAAP basis. QXO reported a preliminary net loss of about $123 million for the quarter (narrower than the $139 million loss a year earlier), and it is unprofitable by standard accounting measures. The losses stem largely from the cost of its acquisition strategy: roughly $288 million of acquisition-related amortization, about $163 million of net interest expense on the debt used to fund deals, and $40 million of transaction costs in the quarter. The company and investors focus on adjusted EBITDA — about $557 million, up 85% — as the operating metric, which strips out those items. That is reasonable for judging the underlying business, but the gap between adjusted EBITDA and the GAAP net loss is real and reflects the price of the roll-up: amortization, interest and deal fees. Whether QXO becomes GAAP-profitable depends on integrating acquisitions, reducing deal activity and servicing its roughly $7 billion of debt.
How did QXO's move compare with other building-products stocks that day?
QXO's move was far larger and specific to its own news. On the same day, building-products peers rose only mid-single digits — Builders FirstSource was up about 5%, Watsco about 4%, and the homebuilders ETF XHB about 4% — while the S&P 500 rose about 2% on a broadly risk-on day. QXO's roughly 20% jump was about four times any of those peer moves, which marks it as a company-specific catalyst (its preliminary quarter) amplified by a strong day for the group, rather than a pure sector move. The distinction matters: the sector tailwind explains part of the gain, but the bulk of QXO's outperformance came from its own results. It is fair to call the move company-specific while acknowledging that building-products stocks broadly had a good day.
What should investors watch next for QXO?
Four things. First and most important, the full third-quarter results on November 12 — organic growth, free cash flow, segment margins and any guidance, the figures the preliminary release omitted and the ones that actually judge a roll-up. Second, organic versus acquired growth: whether QXO is growing the businesses it buys, not just adding them, which separates value creation from financial engineering. Third, leverage and dilution: how QXO manages roughly $7 billion of debt and whether share issuance slows as the integration phase matures, since the share count has risen about 60% in a year. Fourth, the construction backdrop — demand for roofing, insulation and building products as housing and non-residential activity shift. Because the market is paying in advance for the Jacobs roll-up playbook to work, the stock is likely to stay sensitive to any signal about integration quality and cash generation. This is descriptive analysis, not investment advice.