Stock Analysis
Why did SpaceX (SPCX) stock jump on August 7, 2026? An upgrade, a chip fab, and a lock-up that held
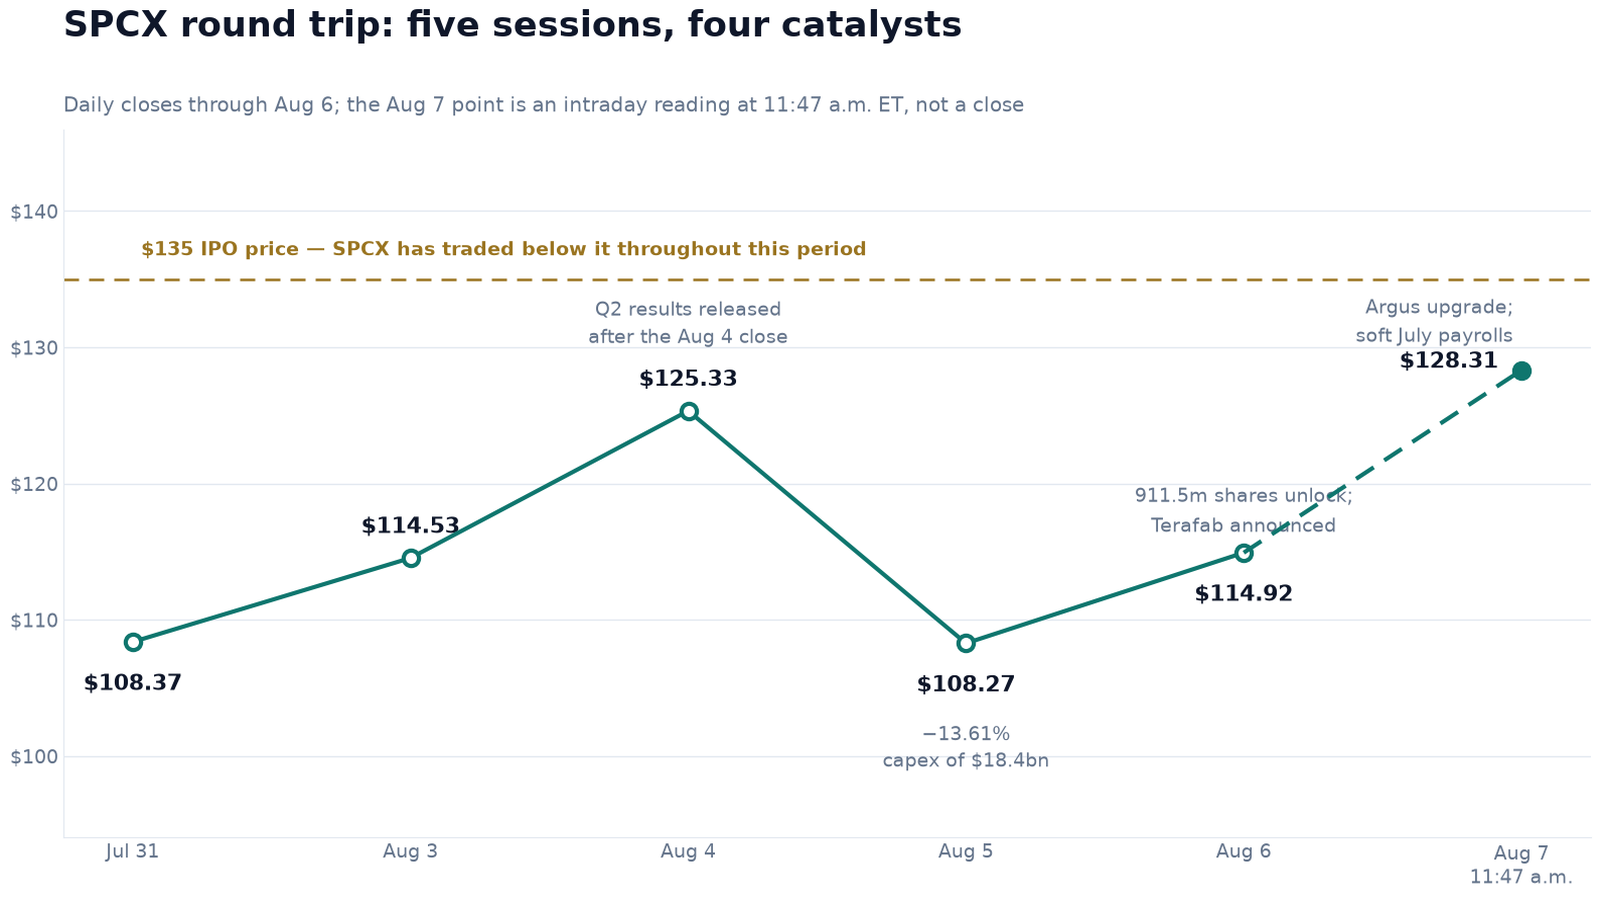
SPCX traded up 11.65% at $128.31 by 11:47 a.m. ET after Argus upgraded it to Buy, SpaceX and Tesla confirmed a $16.8 billion chip plant, and 911.5 million insider shares became eligible to trade without breaking the price. None of it changed the $18.369 billion of quarterly capex behind the selloff — and the next unlock tranche is August 20, not December.
Summary
Space Exploration Technologies Corp. (NASDAQ: SPCX) traded at $128.31, up $13.39 or 11.65% from Thursday's $114.92 close as of 11:47 a.m. ET on Friday, August 7, 2026 [1]. The session was still open at publication: the primary SPCX market snapshot in this article is 11:47 a.m. ET, the cross-check vendor reading is 11:29 a.m. ET, and the peer readings are 11:47–11:50 a.m. ET. Nothing here is a close. On roughly 13.18 billion shares outstanding, the advance had added about $176 billion of market value in a little over two hours [1][5].
The unusual thing about this move is not its size. It is that four candidate causes landed inside 48 hours, and no single session can tell you how the move divides between them. Argus Research upgraded the stock from Hold to Buy with a $160 target on Friday morning [8][9]. On Thursday, SpaceX and Tesla confirmed a $16.8 billion first-phase investment in "Terafab," a chip plant in Grimes County, Texas [12]. Also on Thursday, 911.5 million insider shares became eligible to trade — and the stock rose 6.14% anyway [4][14]. And on Friday morning the July employment report showed the U.S. economy shedding 23,000 jobs against an expected gain of 83,000 [16][17]. This site's own change-event record for the session identifies the same cluster — the revenue growth, the Terafab investment and the absorbed unlock — as the catalyst [23].
What none of those changed is the number behind the selloff. SpaceX spent $18.369 billion on capital expenditure in the second quarter — 2.35 times the $7.814 billion of revenue it earned [6]. Capital intensity was the reason most widely cited for the 13.61% decline on August 5, and it is unaltered by anything that has happened since [6][7]. One plausible reading of Friday is that the market repriced how that spending is financed and how fast it pays back rather than its scale — but that is an interpretation of the tape, not something the tape demonstrates. The stock remains 4.96% below its $135 IPO price and 43.1% below the $225.64 high it set in its first week of trading — a "52-week" high only in the vendor's sense, since SPCX has been listed for eight weeks [1][3].
What did SpaceX actually report?
The second-quarter results, released after the close on Tuesday, August 4, came in above consensus on every revenue line [6]:
| Measure | Q2 2026 | Year over year | Consensus |
|---|---|---|---|
| Total revenue | $7.814bn | +92% | $6.93bn |
| Connectivity (Starlink) revenue | $4.291bn | +66% | $3.83bn |
| AI revenue | $2.561bn | +247% | $2.18bn |
| Space / launch revenue | $962m | +29% | $835m |
| Connectivity operating profit | $1.656bn | +79% | — |
| AI operating loss | −$1.257bn | improved 49% q/q | — |
| Space / launch operating loss | −$542m | — | — |
| Adjusted EBITDA | $3.5bn | +191% | — |
| Operating loss | −$143m | from −$970m | — |
| Net loss | −$541m | from −$1.008bn | — |
| Reported loss per share | −$0.09 | — | −$0.26 estimate |
| Capital expenditure | $18.369bn | 2.35× revenue | — |
| of which AI capex | $15.828bn | 86% of the total | — |
| Starlink subscribers (period end) | 12m | doubled y/y | — |
| Starlink net adds (in the quarter) | 1.7m | — | — |
| Starlink ARPU | $66 | from $85 a year earlier | — |
One presentational note before reading it. The reported loss per share was $0.09 and the headline analyst estimate was a $0.26 loss, but at least one compiler warned that the reported figure was not directly comparable with the consensus figure on an accounting basis [6]. Both are given here; neither is described as an earnings "beat".
Two readings of that table are defensible, which is why the stock has moved 13.61% down and then 11.65% up inside three sessions.
Consolidated operating performance improved materially, but not uniformly — the space and launch segment's $542 million operating loss widened year over year even as everything above it improved. Connectivity — the principal operating-profit engine — produced $1.656 billion of operating profit on $4.291 billion of revenue, a 38.6% margin, growing 79% [6]. The AI segment turned adjusted EBITDA positive at $1.146 billion while still carrying a $1.257 billion operating loss, and that loss narrowed 49% sequentially [6]. The consolidated net loss shrank from $1.008 billion to $541 million on nearly double the revenue. Stated without editorial: losses narrowed while revenue and segment operating profit expanded.
The capital line is the objection. Capex of $18.369 billion in a single quarter is 2.351 times that quarter's revenue, 58.8% of revenue annualised at the second-quarter rate, and 5.25 times the quarter's adjusted EBITDA. The cash consequence is visible in the half-year figures: SpaceX generated $3.466 billion of operating cash flow in the first half of 2026 against capital expenditure of about $28.5 billion — $10.1 billion in the first quarter and $18.369 billion in the second — an operating-cash-flow-minus-capex deficit of roughly $25 billion in six months [35]. That is a proxy rather than the company's own definition of free cash flow, since it ignores other investing and financing flows, but it is the right order of magnitude and it is why a headline revenue beat produced a 13.61% decline.
One line inside the Starlink numbers is routinely misread, including in coverage this week. Subscribers doubled year over year to 12 million with 1.7 million net adds in the quarter, while ARPU of $66 is measured against $85 a year earlier — a 22% year-over-year decline. It is not a sequential drop. The IPO prospectus put Starlink ARPU at $99 a month in 2023, $81 in 2025 and $66 in the first quarter of 2026, so the second quarter held the level rather than falling further from it [6][32]. Connectivity revenue grew 66% against a subscriber base that roughly doubled, which is consistent with a mix shift toward higher-volume, lower-value geographies — though segment revenue carries other mix effects, and period-end subscribers are not the same as the average subscribers generating revenue through the quarter. So far, subscriber growth has more than offset the lower year-over-year ARPU.
The declining ARPU is not a surprise to the company, and that is the part worth carrying forward: the prospectus states that Starlink ARPU is expected to continue declining over the next few years as the subscriber base outside North America grows and lower-priced plans are added [32]. This is a disclosed strategy, not a deterioration the company is discovering. It means the connectivity line should be modelled as volume growth against a deliberately falling price, and it removes "will ARPU recover?" from the list of open questions.
The second quarter also disclosed where the AI revenue came from. SpaceX redirected its Memphis data centres to renting compute, with chief financial officer Bret Johnsen saying the company "monetized available compute capacity" and disclosing $6.7 billion of cloud services revenue under contract over a six-month period beginning in October 2026, with Anthropic and Google named as customers [34]. Capital expenditure for the first half of 2026 exceeded $28 billion, against about $7 billion in the same period of 2025 [34].
Did the lock-up expiration matter?
This was supposed to be the week's risk, and it is worth being precise about what happened — and about what is still coming, because the widely-repeated framing of a single follow-up unlock in December is wrong.
On Thursday, August 6, up to 911.5 million shares held by employees and early investors became eligible to trade — more than the 638.9 million shares sold in the IPO once the underwriters exercised their option in full, against a base offering of 555.6 million [14][15]. If all of it reached the market the potentially tradable pool would rise to roughly 1.55 billion shares, or about 11.8% of the 13.18 billion shares outstanding, against about 4.8% before — figures derived here from the two share counts [5][14]. That is an eligible pool, not a measured float: eligibility does not prove the shares have entered free float, or that data vendors treat them as having done so.
The stock rose 6.14% that day, on 252.7 million shares — more than three times any session in the preceding month, though not a record: roughly 322.1 million traded on June 16 and 272.1 million on June 18 [3][4]. It traded down to $105.11 intraday before recovering [4]. A low print on heavy volume does not establish that unlocked insiders actually sold. Eligibility is not sale.
The December framing needs correcting. Published compilations of the lock-up terms describe a staggered release rather than two dates: a further tranche of roughly 319 million shares on August 20 at a 70-day milestone, additional tranches every two to four weeks through October, a release tied to third-quarter earnings, and the remaining 180-day shares on December 8, 180 days after the June 11 pricing [30][31]. December 8 is the final major unlock, not the next one. The next one is under two weeks away. Elon Musk and holders of roughly 60% of the company stay restricted until mid-2027 [14].
So the correct reading of Thursday is narrower than "the overhang is gone": a specific, dated, widely-forecast supply event passed without breaking the price, which removes one near-term calendar overhang — and even that should be qualified, because more unlocks arrive before December.
Short interest is where this gets misread, and the vendor data invite the error. The reported figure is 165.05 million shares, described as 25.84% of float [5]. That percentage is computed against the vendor's float field of 638.65 million — the pre-unlock IPO float. Against the roughly 1.55 billion eligible-share pool the same short interest is 10.64%. Neither is a clean measure: the first uses a denominator that changed on August 6, the second a hypothetical pool rather than an officially measured float. And the 165.05 million count is itself a settlement-date observation from before the unlock, so it cannot tell you how many shares were short on Friday morning. Covering could plausibly be a real component of an 11.65% morning; there is no Friday covering data, so that stays plausible rather than implied fact.
How much of the move was SpaceX and how much was the market?
The cross-section shows that SPCX rose within a broadly strong growth and space tape. At the same 11:47–11:50 a.m. ET timestamp, Rocket Lab was up 8.51%, AST SpaceMobile 5.77%, Tesla 3.87%, Nvidia 2.53%, and the Invesco QQQ Trust 1.15% [18][19][20][21][22].
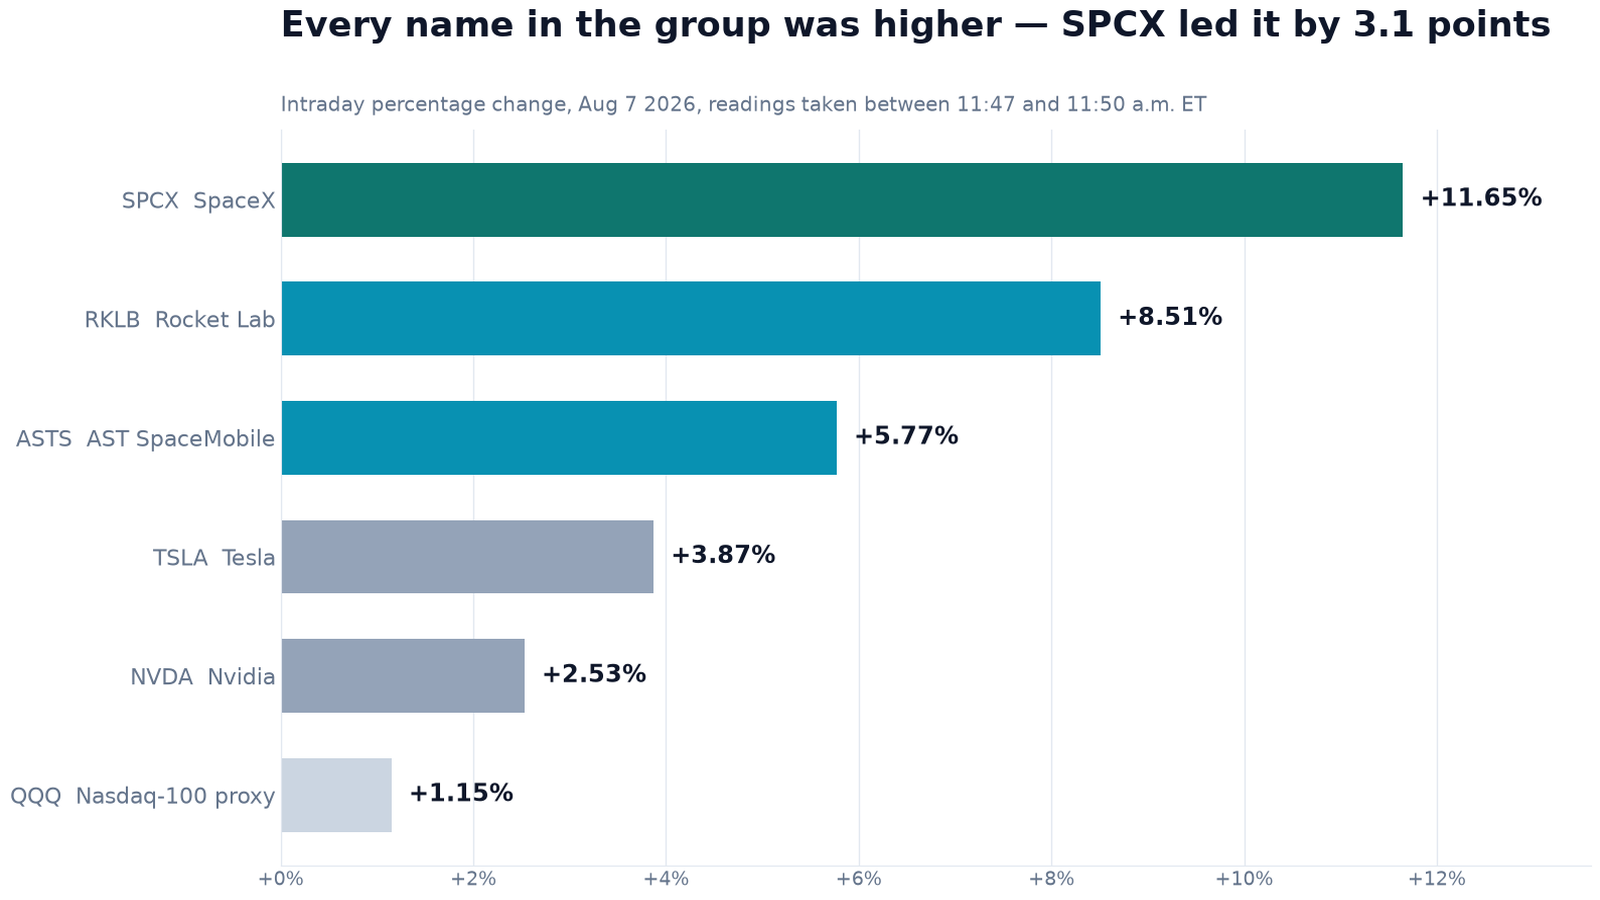
The temptation here is to treat Rocket Lab as a control and read the 3.14-point gap as SpaceX's company-specific component. That does not survive checking, and it is worth saying why rather than quietly dropping it. Neither name was news-free. Rocket Lab was digesting $663 million of Space Force awards announced inside eleven days — $266 million on July 27 and $397 million after the close on August 4 — and completed its 92nd Electron mission, deploying an iQPS satellite, on August 6 [25][26][27]. AST SpaceMobile launched BlueBird satellites 11, 12 and 13 on August 5 [19]. Both report their own quarters on August 10, so both were also carrying pre-earnings positioning.
Even a genuinely news-free peer would not turn relative return into a decomposition. Different betas, short interest, liquidity, options positioning and factor exposures all separate two stocks on the same day. What the cross-section supports is context: every space-adjacent name was up several percent while the index rose 1.15%, so a substantial part of SPCX's move was shared. The 3.14 percentage points over Rocket Lab and 10.50 points over the Nasdaq-100 proxy bracket the company-specific component. They do not measure it, and no precise split is offered here.
Tesla is not an independent observation at all: it is the counterparty to the Terafab investment and shares a chief executive, so its 3.87% is partly the same news. Nvidia's 2.53% carries its own SpaceX read-through — Musk said on August 5 that SpaceX will build its data centres exclusively on Nvidia chips, which moved Nvidia at the time [13].
The macro backdrop is dateable, and the shorthand circulating on Friday was wrong in a way that matters. July non-farm payrolls, released at 8:30 a.m. ET, showed employment falling by 23,000 against a consensus gain of about 83,000, with June revised down by 37,000 to +20,000 and unemployment at 4.1% [16][17]. The policy question live in August 2026 was whether the Federal Reserve would hike in September. The soft report reduced those rate-hike expectations and raised the odds of a hold; contemporaneous coverage differed on whether it made a cut more likely, and this article does not assert that it did [17][33]. For a long-duration growth equity spending $18 billion a quarter, a lower expected path for rates is not a rounding error. The timing and the broad-market response are observable; SPCX's exact macro contribution is not — so a macro contribution is plausible and potentially material, not measured.
How heavy was the volume?
Heavy, and the comparison needs its clock attached. By 11:47 a.m. ET — 137 of the session's 390 minutes, 35.1% elapsed — 132.66 million shares had traded [1]. The 20-day average for a full session is 89.75 million [5]. So the stock had already done 1.48 times a normal entire day's volume in about a third of a day, a crude straight-line run rate of 4.21 times the 20-day average — crude because volume is strongly intraday-seasonal and does not accumulate linearly.
That 20-day average is itself distorted, and saying so matters. It includes August 4 (144.1 million), August 5 (207.0 million) and August 6 (252.7 million) — the very sessions this article is about [3]. Against the pre-event baseline of July 27–31, which ranged from 54.0 million to 81.7 million shares, Friday's morning alone was 1.62 to 2.46 times a full normal day [3]. An independent vendor put the same morning at 122.24 million shares against a three-month average of 120.77 million, and a third gave a 110.34 million three-month average [2][4]; the three averages differ by lookback window and are not expected to agree.
What that establishes is very high participation. It does not establish who was buying, and it does not by itself establish that the ownership base changed hands — one share can turn over repeatedly, and options hedging and high-frequency trading can generate large volume without a wholesale change in beneficial ownership. What is known is that a large eligible supply and a substantial pre-event short interest both existed. Actual selling by unlocked holders and actual covering by shorts are not known from Friday's tape, and index and hedging flow clears through the same order book as everything else.
Valuation scenarios
What follows is an illustrative weighted price-anchor exercise, not a valuation model and not a price forecast. The probabilities are the author's own illustrative weights, they sum to 100%, and each price is anchored to a published, dated figure rather than to a model.
| Scenario | Price anchor | Illustrative weight | Basis | Conditions associated with it |
|---|---|---|---|---|
| High | ~$248 | 20% | Bernstein's Aug 6 target [11] | The guided $100bn December run rate is met, the AI segment reaches operating profitability, Terafab's first phase proceeds at its announced cost, and no external equity is required |
| Middle | ~$215 | 40% | Mean of the eight post-earnings targets, author-derived [10][28] | Capex stays near current levels, connectivity margins hold near 39%, and the August 20 and later unlock tranches are absorbed as August 6 was |
| Low | ~$105 | 40% | The listing low of $104.83, traded on Aug 3 [1] | The run-rate guidance slips, capital needs exceed the net cash position, later unlock tranches meet a thinner bid, or Starlink net adds decelerate while ARPU keeps falling as the company has guided |
| Weighted | ~$178 | 100% | Author's weights | 38.6% above the $128.31 intraday price |
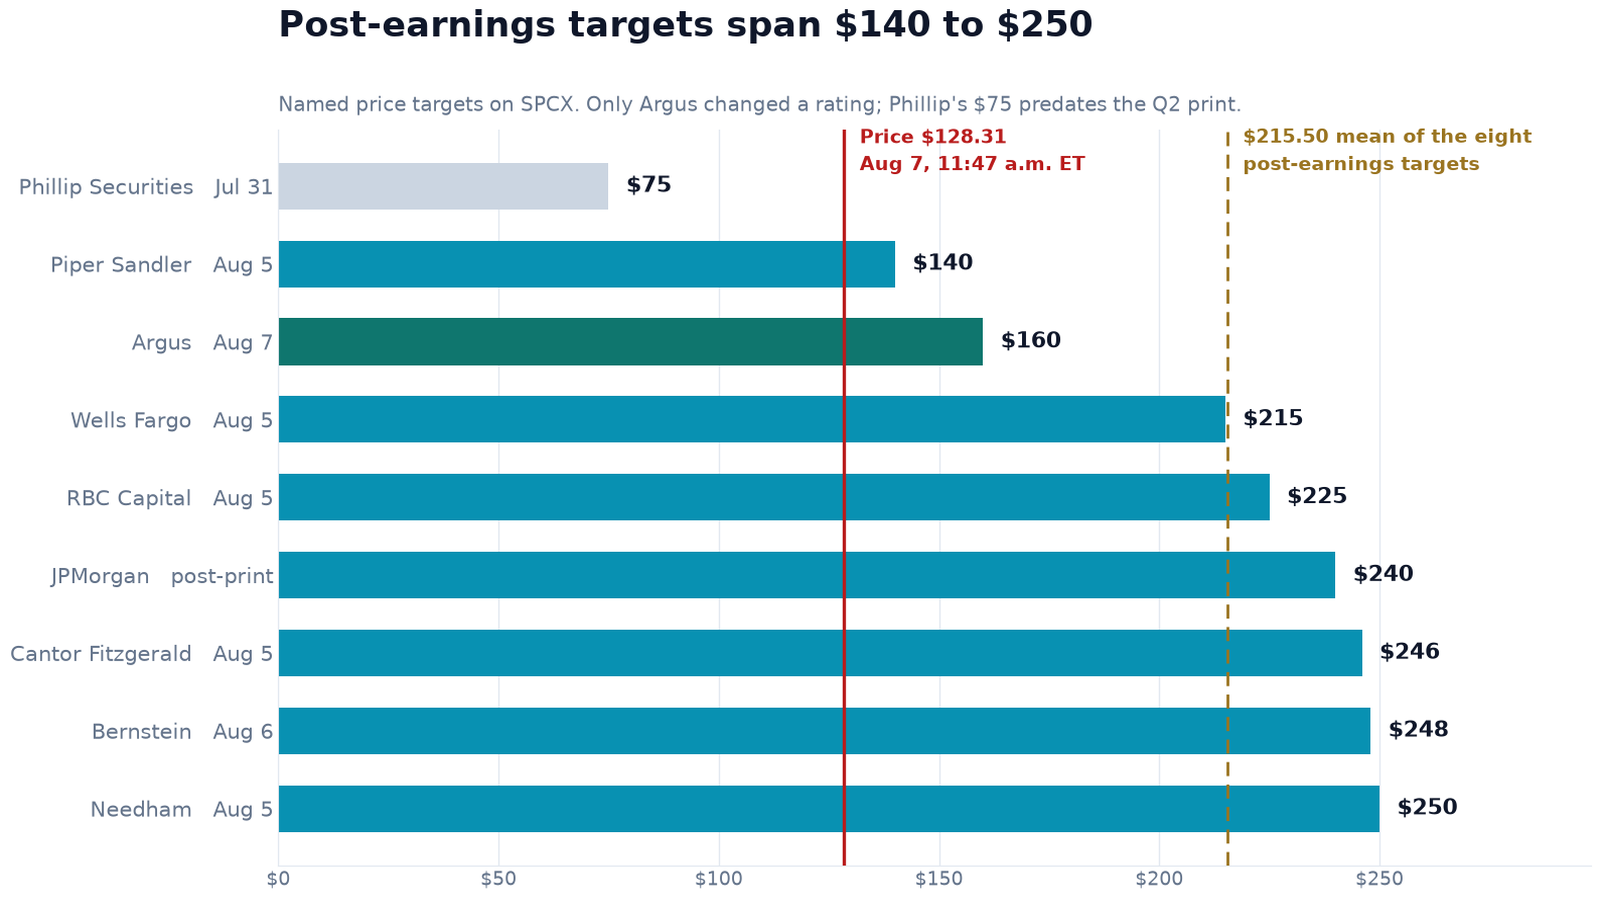
Four caveats belong with that table. The low anchor is a price this stock traded at four sessions ago, not a modelled downside — and at $104.83 the market capitalisation would still be about $1.382 trillion, roughly 44.2 times revenue annualised at the second-quarter rate, so it is a de-rating rather than a collapse. The 40% weight on it is a judgement, not a derivation: an unlock increases eligibility and liquidity, it does not mechanically imply downward pressure, and a reader who disagrees should reweight. The middle anchor is a mean the author computed across eight targets, not a published consensus — published figures vary materially by compiler and update timing, with StockAnalysis showing $233 across 35 analysts and MarketBeat $228.95 across 16 on the same day, both dominated by initiations dated July 7, a month before the capex figure existed [10][11]. And several of the reiterations in that mean are aggregator-displayed targets rather than confirmed post-print notes, which is a real limitation of the set. The disagreement about this company is not about the quarter. It is about whether $18 billion a quarter buys the guided $100 billion run rate, and no target average resolves that.
Why it matters
Five weeks ago this stock had never traded below its $135 IPO price, and that was the strongest thing you could say about it. It fell through that level during July and has not reclaimed it; at $128.31 the stock is 4.96% below [1][3]. The largest U.S. IPO by gross proceeds — roughly $85.7 billion once the underwriters' option was exercised in full — is, eight weeks in, underwater for anyone who bought the deal [14].
What Friday changed is narrower than the percentage implies. Three of the four catalysts — the upgrade, the absorbed unlock, the payrolls print — bear on the discount applied to a business whose operating trajectory was already known on Wednesday. Terafab is the exception, but only partly: earlier reporting had already described the Grimes County project, Intel's involvement and an aggregate figure of up to roughly $119 billion, so Thursday made the first phase concrete rather than revealing the overall project [12]. Nor is the direction obvious: earlier reporting had described a proposed initial investment far larger than the $16.8 billion actually confirmed, so Thursday's number is smaller than what had been trailed, against the same up-to-$119 billion aggregate. What remains undisclosed is the part that matters most to SPCX holders — the split between Tesla and SpaceX, Intel's role, and the phasing of the remainder.
A market that sold the stock 13.61% on capital intensity on Wednesday bought it 11.65% on Friday. That is not a contradiction: the same capital project can rationally reprice as information arrives about cost, timing, financing, discount rates and expected returns. The $100 billion December run-rate guidance now in the open is exactly the kind of information that does it — if it is met.
What to watch
August 20, 2026. The next unlock tranche, roughly 319 million shares at the 70-day milestone, with further tranches every two to four weeks into October [30][31]. August 6's absorption is genuine evidence, but it happened in a week with an upgrade, a chip-plant announcement and a soft jobs print all pushing the other way. The next one will be a cleaner test, and it is under two weeks away.
The December run-rate guidance. A $100 billion annual recurring revenue run rate by December, against $7.814 billion of second-quarter revenue, is the most consequential number the company has put in front of investors — and the gap between it and the reported quarter is what separates a 54× multiple from a 17× one [28]. The third-quarter report is the first checkpoint.
The third-quarter cash-flow statement, not just the capex line. The first half generated $3.466 billion of operating cash flow against about $28.5 billion of capex — roughly a $12.5 billion quarterly deficit, which $60.30 billion of net cash covers for about five quarters [5][35]. Whether an external raise becomes necessary depends on whether that deficit widens with Terafab or narrows as the AI segment's contracted revenue lands from October. Capex alone will not answer it; the operating cash flow line beside it will.
Starlink net adds, not ARPU. ARPU was $66 against $85 a year earlier and flat against the first quarter, and the prospectus says the company expects it to keep declining as the mix shifts internationally and cheaper plans are added [32]. So a further ARPU decline is the disclosed plan, not a warning sign. The number that actually matters is whether net adds hold near 1.7 million a quarter, because on a deliberately falling price, volume is the only thing carrying the connectivity line [6].
Whether the sell side re-marks. Ten of the targets on the panel are July 7 initiations. As those refresh against a quarter carrying $18.4 billion of capex and a $100 billion run-rate guide, the published consensus will move — and the direction it moves is a better signal than its current level [11].
Frequently asked questions
Why did SpaceX (SPCX) stock go up on August 7, 2026?
SPCX traded up 11.65% at $128.31 as of 11:47 a.m. ET, from Thursday's $114.92 close, on a combination of four things rather than one. Argus Research upgraded the stock from Hold to Buy with a $160 target that morning, arguing the payback on its AI capital spending arrives fast enough to justify the scale. On Thursday, SpaceX and Tesla announced a $16.8 billion first-phase investment in Terafab, a chip plant in Grimes County, Texas. Also on Thursday, 911.5 million insider shares came free of lock-up and the stock rose 6.14% anyway, removing a dated supply event that many holders had been waiting on. And on Friday morning the July employment report showed payrolls falling by 23,000 against an expected gain of 83,000, which lifted the whole market — the live policy question was whether the Federal Reserve would hike in September, and the soft print reduced those rate-hike expectations and raised the odds of a hold. The broader tape was strong — the Invesco QQQ Trust was up 1.15% and Rocket Lab, the closest listed comparable, was up 8.51% — so a substantial part of the move was shared rather than company-specific. No name in that comparison group was news-free, though: Rocket Lab was digesting $663 million of Space Force awards announced on July 27 and August 4 and had flown its 92nd Electron mission on August 6, and AST SpaceMobile had launched three BlueBird satellites on August 5. The 3.1-point gap over Rocket Lab and the 10.5-point gap over the index therefore bracket the company-specific component rather than measure it.
What were SpaceX's Q2 2026 results?
Revenue was $7.814 billion, up 92% year over year, against a $6.93 billion consensus. Connectivity (Starlink) contributed $4.291 billion, up 66%, with operating profit of $1.656 billion, up 79%. The AI segment produced $2.561 billion, up 247%, with an operating loss of $1.257 billion that narrowed 49% sequentially and adjusted EBITDA that turned positive at $1.146 billion. Space and launch revenue was $962 million, up 29%, with a $542 million operating loss. Adjusted EBITDA was $3.5 billion, up 191%. The consolidated operating loss narrowed to $143 million from $970 million and the net loss to $541 million from $1.008 billion, giving a loss of $0.09 a share against a consensus loss of $0.26. Starlink ended the quarter with 12 million subscribers, double the year-ago level, after 1.7 million net adds in the quarter, with ARPU of $66 against $85 a year earlier — flat against the first quarter rather than a fresh decline, and the prospectus says the company expects ARPU to keep falling as the mix shifts internationally. Capital expenditure was $18.369 billion, of which $15.828 billion went to AI; first-half capex exceeded $28 billion against about $7 billion a year earlier. The reported loss per share was $0.09 against a $0.26 estimated loss, though at least one compiler warned the two were not directly comparable on an accounting basis. Management also guided to a $100 billion annualised revenue run rate by year-end 2026 and disclosed $6.7 billion of cloud services revenue under contract over six months from October, with Anthropic and Google as customers.
Why did SpaceX stock fall 13.6% on August 5 if revenue beat?
Because of one line that did not beat. Capital expenditure came in at $18.369 billion for the quarter — 2.35 times the $7.814 billion of revenue earned in the same three months, and 5.25 times the quarter's adjusted EBITDA. About 86% of it, $15.828 billion, went into AI infrastructure. Capital intensity was the reason most widely cited in coverage of the decline, though contemporaneous reporting also discussed the impending lock-up. The cash consequence is visible in the half-year figures: $3.466 billion of operating cash flow in the first half against about $28.5 billion of capex, a deficit of roughly $25 billion in six months. That is why the financing question dominated the reaction to a revenue beat. Nothing on August 6 or 7 changed the capex figure itself. The Argus upgrade, the Terafab confirmation and the absorbed unlock all bear on the discount applied to the same spending — and the same capital project can rationally reprice as information about cost, timing, financing and expected returns arrives.
What happened to SpaceX's lock-up expiration on August 6?
Up to 911.5 million shares held by employees and early investors became eligible to trade — more than the 638.9 million shares sold in the IPO once the underwriters exercised their option in full. If all of it reached the market the potentially tradable pool would rise to roughly 1.55 billion shares, about 11.8% of the 13.18 billion shares outstanding against about 4.8% before. That is an eligible pool, not a measured float. The stock rose 6.14% that day on 252.7 million shares — more than three times any session in the preceding month, though not a record, since roughly 322.1 million traded on June 16 — after trading down to $105.11 intraday first. A low print on heavy volume does not establish that unlocked insiders actually sold; eligibility is not sale. The common claim that the next unlock is in December is wrong: published compilations of the terms describe a staggered schedule, with roughly 319 million more shares released at a 70-day milestone on August 20, further tranches every two to four weeks into October, a release tied to third-quarter earnings, and the remaining 180-day shares on December 8. December 8 is the final major unlock, not the next one. Elon Musk and holders of about 60% of the company remain restricted until mid-2027.
Is SpaceX stock below its IPO price?
Yes, and this is a change from the early weeks. SPCX priced its IPO at $135 in June 2026 and did not trade below that level during the first post-IPO selloff — the line that broke back then was the $150 opening trade, not the IPO price. The stock fell through $135 during July and has not reclaimed it. At $128.31 as of 11:47 a.m. ET on August 7 it sits 4.96% below the IPO price and 43.1% below the $225.64 high it set in its first week of trading, even after an 11.65% morning. That $225.64 is labelled a 52-week high by data vendors, but SPCX has only been listed for eight weeks, so it is really a since-listing high. Anyone who bought the largest U.S. IPO by gross proceeds at the deal price is, eight weeks in, underwater.
What is Terafab and how much is SpaceX investing?
Terafab is a semiconductor plant that Tesla and SpaceX announced jointly on August 6, 2026, to be built in Grimes County, Texas, north of Houston. The announced first-phase investment is $16.8 billion across both companies, and the split between them has not been disclosed. The facility is described as spanning more than 100 million square feet and producing advanced logic and memory devices optimised for edge computing and inference — chips for Tesla's Optimus robots and Cybercab, and processors for SpaceX's space-based data centres. Intel has committed to contributing on undisclosed terms, and the site is expected to employ at least 3,000 people. SpaceX has pointed to potential total spending of as much as $119 billion across multiple phases. For SpaceX shareholders the open question is how much of that total lands on this balance sheet, given the company is already spending $18.4 billion a quarter.
What did analysts do after SpaceX's Q2 2026 earnings?
They dispersed rather than converged, and they moved in both directions. Eight firms carried targets after the August 4 print, spanning $140 to $250. Two cut: Piper Sandler to $140 from $156 while staying Neutral, and Wells Fargo to $215 from $230 while staying Overweight. One raised: JPMorgan's Doug Anmuth to $240 from $225 at Overweight, citing SpaceX's vertical integration and anchoring the number to 34 times a 2028 estimated EPS of $7.02. Needham reiterated Buy at $250, Cantor Fitzgerald Overweight at $246, RBC Capital's Kenneth Herbert Outperform at $225, and Bernstein's Douglas Harned set $248 on August 6. The single rating change came on August 7, when Argus Research's Steven Silver upgraded to Buy from Hold while keeping a $160 target — notable because $160 is the second-lowest target on the sheet, below every bull it joined. Published consensus figures are a poor guide here and disagree with each other: StockAnalysis showed $233 across 35 analysts and MarketBeat $228.95 across 16 on the same day, both dominated by initiations dated July 7, a month before the capital-expenditure figure existed. The panel range runs from $62 to $800.
How much short interest is there in SPCX, and was this a short squeeze?
The reported short interest is 165.05 million shares, and the widely-quoted 25.84% of float is misleading as of this week. That percentage is computed against a float field of 638.65 million shares, which is the pre-unlock IPO float. Measured against the roughly 1.55 billion eligible-share pool, the same short interest is 10.64% — but that denominator is a hypothetical pool rather than an officially measured float, so neither percentage is clean. The share count is also reported to a settlement date that precedes the August 6 unlock, so it is a pre-event reading and cannot tell you how many shares were short on Friday morning. What can be said is that short positioning was heavy going into the week and that covering could plausibly be a real component of an 11.65% morning. What cannot be said is that it caused the move: there is no Friday covering data. Newly eligible holders selling, index and hedging flow, discretionary buying and short covering all clear through the same order book, and a single session's tape cannot separate them. What is known is that a large eligible supply and a substantial pre-event short interest both existed; actual selling and actual covering are not known.
How unusual was SPCX trading volume on August 7?
Very high, with the caveat that the session was still open. By 11:47 a.m. ET — roughly 137 of the session's 390 minutes, about 35% elapsed — 132.66 million shares had traded, against a 20-day average of 89.75 million for a full session. That is about 1.5 times a normal entire day's volume in a third of a day, a run rate near 4.2 times the 20-day average. But that average is itself distorted, because it includes August 4 (144.1 million), August 5 (207.0 million) and August 6 (252.7 million) — the very sessions in question. Against the pre-earnings baseline of July 27–31, which ranged from 54.0 million to 81.7 million shares, Friday's morning alone was already about twice a normal full day. Two other vendors put the three-month average at 110.34 million and 120.77 million shares; the three figures differ by lookback window and are not expected to agree.