Consumer
Burlington (BURL) Stock Falls ~5% as Q3 Outlook Overshadows Q2 Beat
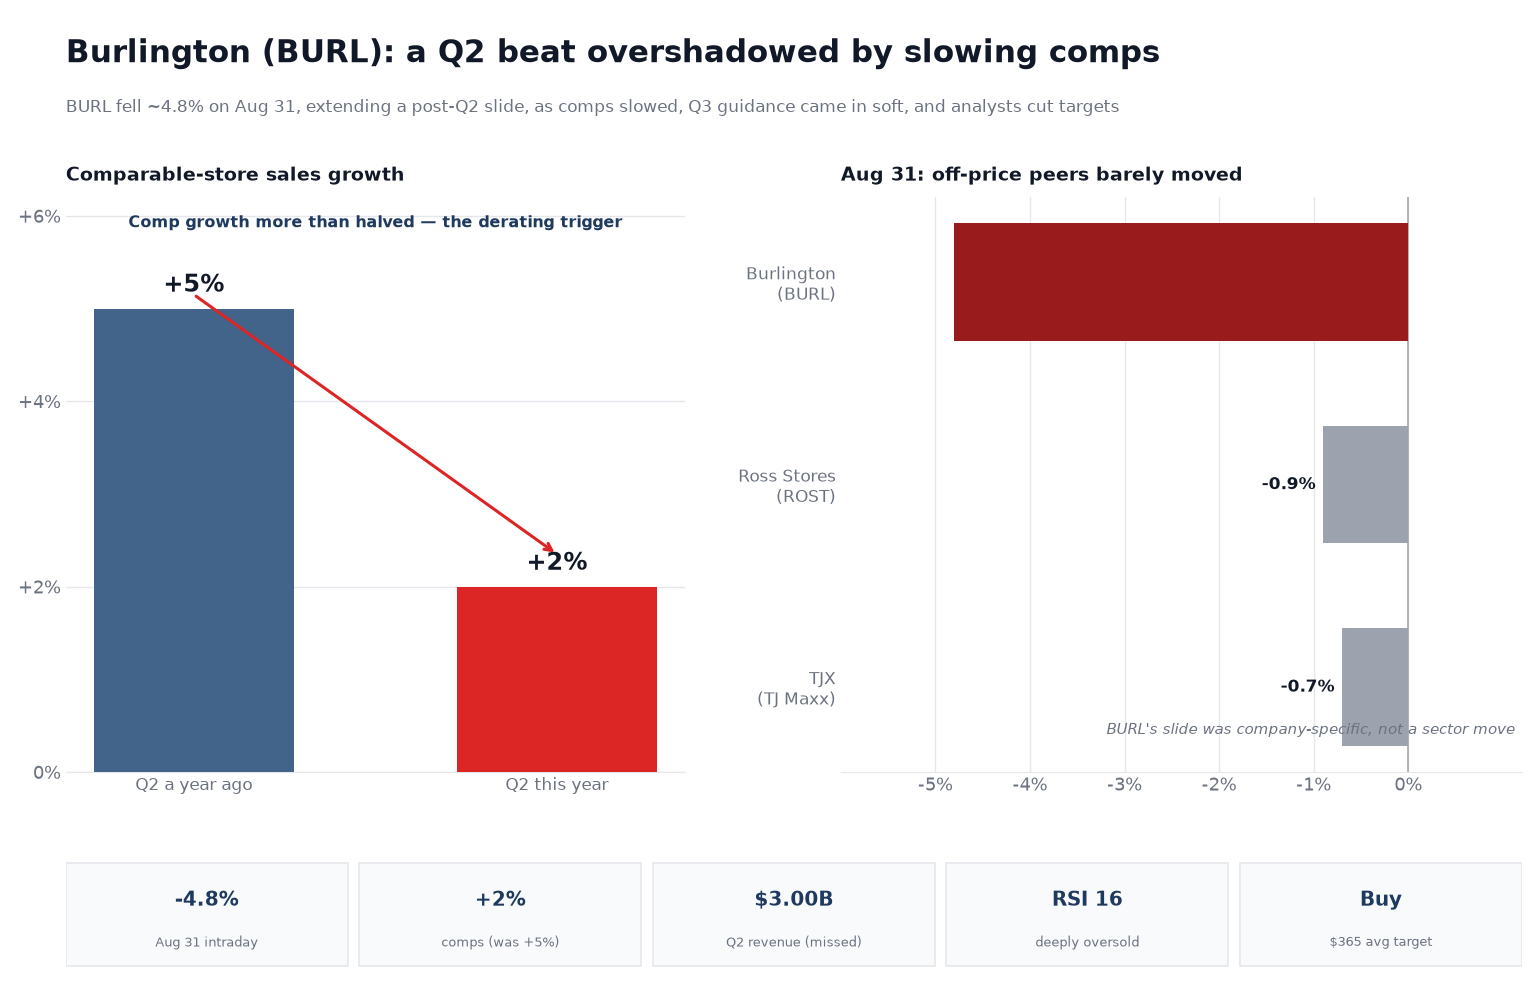
Burlington Stores fell about 4.8% to around $259.76 intraday on August 31, its third straight decline since the August 27 fiscal Q2 report (down ~7.6% on the 27th and ~5.9% on the 28th). The headline looked strong — reported adjusted EPS of $2.96, roughly 35% above consensus, with margin expansion and a 15th straight quarter of double-digit EPS growth — but the market looked past it. Comparable-store sales grew just 2% (down from 5% a year earlier), revenue narrowly missed at ~$3.00 billion, and Burlington guided third-quarter margins and EPS lower as it reinvests a $55 million tariff refund into customer prices. That refund also flattered the headline beat: Burlington's cleaner adjusted EPS ex-refund was $2.37 (still +38% year over year). Even though it raised full-year EPS guidance to $11.77–$11.97, a stock at ~23x earnings could not sustain a 2% comp and softer near-term margins, and Monday's leg down came as Goldman Sachs and Deutsche Bank cut targets. The move was company-specific: off-price peers Ross Stores and TJX fell less than 1% the same day. The stock is now deeply oversold (down ~31% from its high), yet 18 analysts keep a Buy consensus and a ~$365 average target.

Why Burlington stock dropped — a Q2 beat overshadowed by a soft Q3 outlook
On Monday, August 31, 2026, Burlington Stores (NYSE: BURL) fell about 4.8% to around $259.76 in intraday trading — its third straight decline since the off-price retailer reported fiscal second-quarter results before the open on August 27 [1]. By Monday, the stock had already dropped roughly 13% in the two prior sessions (down about 7.6% on August 27 and 5.9% on August 28), and Monday's leg lower coincided with fresh price-target cuts from Goldman Sachs and Deutsche Bank [6]. On its face the quarter looked strong — reported adjusted earnings of $2.96 a share, roughly 35% above consensus, about 100 basis points of margin expansion, and a 15th straight quarter of double-digit EPS growth [2]. But the market looked past the headline to the quality of the beat and a soft near-term profit outlook.
A growth derating, not a full-year cut
Three things drove the reaction. First, comparable-store sales grew just 2% — below the roughly 3% analysts expected and down from a 5% gain a year earlier, so comp growth more than halved, even if it stacks to a respectable 7% over two years [2]. Second, revenue of about $3.00 billion (up 11%) narrowly missed the roughly $3.03 billion analysts expected [2]. Third, and most concretely, the near-term profit outlook came in soft: Burlington guided third-quarter operating margin down 60–80 basis points and, by Street estimates, third-quarter EPS well below the roughly $2.04 consensus [2]. That guidance reflects a deliberate strategic choice — management is reinvesting a $55 million tariff refund into sharper customer prices across the back half (roughly 40% in the third quarter, 60% in the fourth) rather than banking it [2]. Crucially, that also colors the headline beat: the reported $2.96 adjusted EPS included the tariff-refund benefit, while Burlington's cleaner adjusted figure, excluding refunds and certain lease costs, was $2.37 — still up about 38% year over year, but a smaller beat than the headline suggested [2]. For a stock at roughly 23 times earnings, a 2% comp, a revenue miss, and near-term margin reinvestment were enough to force a re-rating — even though Burlington actually raised its full-year adjusted-EPS guidance, to $11.77–$11.97, passing the Q2 upside through to the year [2].
Cheap by its own history, but still de-rating
The reaction has left Burlington deeply out of favor. The stock is down about 31% from its 52-week high of $378, sits roughly 17% below its 200-day moving average, and carries a relative-strength index in the mid-to-high teens — a level that signals deeply oversold conditions [3]. Against that, the business is still growing: trailing revenue rose about 11%, and earnings per share climbed more than 30% over the past year [3]. The tension is the same one facing every premium-multiple retailer whose growth is normalizing — the shares can be cheap relative to their own recent history while the market keeps compressing the multiple until comps re-accelerate. Burlington reaching non-discretionary, treasure-hunt value shoppers is a structural tailwind; convincing investors the growth algorithm is intact after a 2% comp is the near-term challenge.
Why it matters
Burlington's slide is a clean read on how the market is treating off-price retail's growth premium. The sector — Burlington, TJX and Ross Stores — has been a haven, taking share as shoppers trade down and as full-price retailers stumble. But that reputation earned these stocks premium multiples, and a premium multiple demands sustained comps. This site covered Ross Stores' own quarter, where a tariff-refund benefit and decelerating comps were also central; Burlington's report rhymes with it, but the market's verdict was harsher because Burlington's multiple is higher and its comp slowed more visibly. The broader signal is that "beat on EPS, slow on comps" is no longer good enough for the retailers investors had been paying up for — the bar has moved from profitability to proof of durable top-line growth.
A company-specific move, not a sector one
The clearest evidence that this was about Burlington, not off-price retail broadly, is the cross-section on the same day [5]:
| Name (ticker) | Aug 31, 2026 | Read-through |
|---|---|---|
| BURL — Burlington | −4.8% | Comps decelerated to +2%, revenue missed, targets cut [1][2] |
| ROST — Ross Stores | −0.9% | The closest peer barely moved — no sector read-across [5] |
| TJX — TJX Companies | −0.7% | The off-price leader held up, confirming a Burlington-specific reaction [5] |
When a stock falls 4.8% while its two closest competitors move less than 1%, the market is repricing that company, not the industry [5].
What the Street did
Analyst reaction was a study in trimming, not turning. The consensus across 18 analysts stayed a Buy, with an average target near $365 (about 40% above the price), a median of $367.50, a high of $440 and a low of $290 [6]. On August 31, Goldman Sachs' Brooke Roach kept a Buy but cut her target to $382 (from $394), while Deutsche Bank's Krisztina Katai reiterated Hold and cut to $323 (from $367) [6]. Days earlier, UBS's Jay Sole had reiterated a Buy at a Street-high $440, Bernstein's Aneesha Sherman trimmed to $355 (from $365, Buy) and Truist's Joseph Civello stayed at Hold [6]. The pattern — lower targets, mostly unchanged ratings — says the Street sees a slower quarter, not a broken story.
What to watch
- Comps re-acceleration. The single most important metric is whether comparable-store sales bounce back above the low single digits; a second soft quarter would validate the derating [2].
- Margins and the price investment. Watch whether reinvesting into lower prices is a one-time competitive move or a sustained margin headwind [2].
- Third-quarter guidance. Management guided revenue near $2.98 billion; watch the tone on traffic and the holiday setup [2].
- The oversold bounce. With an RSI near 16, watch whether the stock stabilizes or keeps de-rating. Moves are tracked on the BURL stock page [1].
Illustrative valuation sensitivity
The scenarios below are anchored to Burlington's forward earnings power (about 21× forward earnings today) and to the analyst target distribution (low $290, average ~$365, high $440) [6], turning on whether comparable-store sales re-accelerate. They are a descriptive, author-weighted exercise — not a forecast, target, recommendation, or intrinsic fair-value calculation — with subjective weights that sum to 100%.
| Scenario | Illustrative price | Weight | Key drivers |
|---|---|---|---|
| Upside | ~$340 | 30% | Comps re-accelerate, the price investment drives traffic, and the deeply oversold stock re-rates toward the analyst average as double-digit EPS growth continues [6]. |
| Middle | ~$290 | 40% | Comps stay soft but positive; the stock stabilizes near the low end of the target range as the multiple resets to slower growth [6]. |
| Downside | ~$240 | 30% | Comps stall or turn negative and margins compress from continued price investment, pushing the stock toward its 52-week low [3]. |
Weighting those (0.30 × $340 + 0.40 × $290 + 0.30 × $240) gives an author-weighted reference value near $290, above Monday's $259.76 close and at the low end of the analyst range [1][6] — reflecting a high-quality, still-growing retailer whose debate is entirely about the pace of comps and the multiple they support. This is a Street-target-and-scenario exercise and descriptive analysis of an earnings move, not investment advice.
BURL data snapshot — August 31, 2026
| Figure | Value | As-of / source |
|---|---|---|
| Intraday quote | ~$259.76 (−~4.8%), an intraday reading (the session was still open) | Mon, Aug 31, 2026 — StockAnalysis [1] |
| Recent slide | $272.95 Aug 28 close; the stock fell ~7.6% on Aug 27 and ~5.9% on Aug 28 after the pre-open earnings report (≈13% before Monday) | Aug 27–31, 2026 [1] |
| 52-week range / trend | $240.49–$378.33; down ~31% from the high and modestly lower over 52 weeks; ~17% below its ~$313 200-day average; RSI in the mid-to-high teens (deeply oversold) | As of Aug 31 [3] |
| Market cap / EV | ≈$16.3B (62.8M shares); enterprise value ≈$21.5B; beta ≈1.47 | Aug 31 — StockAnalysis [3] |
| Valuation | Trailing P/E ≈23×; forward P/E ≈21–22×; ≈1.3× sales; no dividend | Aug 31 — StockAnalysis [3] |
| Q2 FY2026 results | Revenue ~$3.00B (+11%, slight miss vs ~$3.03B est); comps +2% (on +5% last year); reported adjusted EPS $2.96 (vs ~$2.19 consensus) — but that includes a ~$55M tariff refund; cleaner adjusted EPS ex-refund was $2.37 (+38% YoY); GAAP EPS $2.88; adjusted EBIT margin +~100bps ex-refund | Reported Aug 27 — company [2] |
| Guidance | Q3 operating margin guided down 60–80bps and Q3 EPS well below the ~$2.04 consensus (the tariff refund is reinvested into prices ~40% in Q3 / 60% in Q4); full-year adjusted EPS guidance raised to $11.77–$11.97 (+16–18%) | Aug 27 — company [2] |
| Financials (TTM) | Revenue ≈$12.2B (+10.9%); net income ≈$714M (+30.7%); EPS $11.13 (+31.2%); gross margin ≈44%; operating margin ≈7.8% | TTM — StockAnalysis [3] |
| Volume | Elevated — running well above the ~1.2M 20-day average (roughly 2× or more intraday, per market data) | Aug 31 [1] |
| Same-day peers | ROST −0.9%, TJX −0.7% — off-price peers barely moved | Aug 31 [5] |
| Analyst view | 18 analysts (11 strong buy / 2 buy / 5 hold), consensus Buy, avg target ≈$365 (median $367.50, high $440, low $290); Aug 31 cuts — Goldman $382 (from $394), Deutsche Bank $323 (from $367) | Aug 2026 — StockAnalysis / analyst notes [6] |
The setup at a glance
| Question | Answer |
|---|---|
| Why did Burlington stock drop? | Because a strong-looking profit beat was overshadowed by slowing sales growth and a soft near-term profit outlook. Burlington reported fiscal Q2 results before the open on August 27: reported adjusted EPS of $2.96 (about 35% above consensus), but comparable-store sales grew only 2% (down from 5% a year earlier), revenue narrowly missed, and third-quarter margin and EPS guidance came in soft. The stock fell ~7.6% on August 27 and ~5.9% on August 28, then dropped another ~4.8% intraday on August 31 as Goldman Sachs and Deutsche Bank cut their price targets [1][2]. |
| If EPS beat, why did the stock fall? | Because the market is paying for growth, and both the top line and the near-term outlook softened. At about 23 times earnings, Burlington's multiple assumed durable double-digit comps; a deceleration to 2% undercuts that, and revenue also missed. On top of that, the reported EPS beat was flattered by a tariff refund (see below), and Burlington guided third-quarter operating margin down 60–80 basis points and third-quarter EPS well below the ~$2.04 consensus as it reinvests that refund into lower prices. A good headline was reframed as a slowing, margin-reinvesting quarter — even though full-year guidance was raised [2][3]. |
| Was the EPS beat inflated by the tariff refund? | The headline figure, yes — partly. Burlington's reported adjusted EPS of $2.96 (versus ~$2.19 consensus) included a roughly $55 million tariff refund; its cleaner adjusted EPS, excluding the refund and certain lease costs, was $2.37 — still up about 38% year over year, but a smaller beat than the headline. Management is reinvesting the refund into sharper customer prices across the back half of the year (about 40% in Q3, 60% in Q4), which pressures near-term margins even as it passed the upside through to a raised full-year outlook. So the profit growth is real, but the headline overstated the quarter's cleanliness [2]. |
| Is Burlington stock cheap now? | By its own history, it looks washed out — down about 31% from its 52-week high, roughly 17% below its 200-day average, and with an RSI in the mid-to-high teens (deeply oversold). But it still trades around 21 times forward earnings, a premium that requires comps to hold up. Whether it is 'cheap' depends on whether growth re-accelerates; a premium multiple on slowing comps can compress further even after a big drop [3]. |
| What is the biggest risk now? | That the 2% comp is the start of a slower growth phase rather than a one-quarter blip. If comparable sales stay soft and margins compress from continued price investment, the multiple can keep de-rating toward the low end of analyst targets. The off-price model is resilient, but Burlington's premium valuation leaves little room for disappointment [6]. |
| What do analysts think? | Constructive but trimming. Of 18 analysts, 13 rate Burlington a buy-equivalent and 5 a hold, for a Buy consensus with an average target near $365 — about 40% above the price — ranging from $290 to $440. On August 31, Goldman Sachs cut its target to $382 and Deutsche Bank to $323; days earlier UBS reiterated a Street-high $440. Lower targets with mostly unchanged ratings signal a slower quarter, not a broken thesis [6]. |
Burlington (BURL) stock FAQ
Why did Burlington (BURL) stock drop on August 31, 2026?
Because a strong-looking profit beat was overshadowed by decelerating sales growth and a soft near-term profit outlook. Burlington reported fiscal second-quarter results before the open on August 27: reported adjusted earnings of $2.96 a share topped consensus by roughly 35%, but comparable-store sales grew only 2% (down from 5% a year earlier), revenue of about $3.00 billion narrowly missed, and third-quarter margin and EPS guidance came in soft. The stock fell about 7.6% on August 27 and 5.9% on August 28, then dropped another ~4.8% intraday on August 31 to around $259.76 as Goldman Sachs and Deutsche Bank cut their price targets. The concern was the slowing top line and near-term margins, not the headline beat.
If Burlington beat on earnings, why did the stock fall?
Because at roughly 23 times earnings, Burlington's valuation was built on the expectation of durable double-digit comparable-store sales growth. A deceleration to a 2% comp undercuts that premise, and revenue also came in slightly light. Just as important, the near-term profit outlook softened: the company guided third-quarter operating margin down 60–80 basis points and third-quarter EPS well below the roughly $2.04 consensus, because it is reinvesting a $55 million tariff refund into sharper customer prices across the back half of the year. The reported EPS beat was also flattered by that refund. So even though full-year guidance was raised, the market focused on slowing comps and near-term margin pressure and re-rated the multiple.
Was Burlington's EPS beat inflated by the tariff refund?
The headline figure, partly. Burlington's reported adjusted EPS of $2.96 (versus roughly $2.19 consensus) included a benefit from a roughly $55 million tariff refund; its cleaner adjusted EPS, excluding the refund and certain lease costs, was $2.37 — still up about 38% year over year, but a smaller beat than the headline suggested. Management is reinvesting that refund into sharper customer prices across the back half of the year (about 40% in the third quarter, 60% in the fourth), which pressures near-term margins even as it passed the upside through to a raised full-year outlook. So the underlying profit growth is real, but the reported figure overstated how clean the quarter was — one reason the stock looked through the beat.
Is Burlington stock cheap after the drop?
By its own recent history, it looks washed out: the shares are down about 31% from their 52-week high of $378, sit roughly 17% below their 200-day moving average, and carry a relative-strength index in the mid-to-high teens, a level that signals deeply oversold conditions. But the stock still trades at about 21 times forward earnings, a premium that depends on comparable-store sales holding up. Whether it is genuinely cheap hinges on whether growth re-accelerates — a premium multiple on slowing comps can keep compressing even after a sharp decline.
What is the biggest risk for Burlington now?
That the 2% comparable-sales figure marks the start of a slower growth phase rather than a one-quarter blip. If comps stay soft or turn negative and margins compress from continued price investment, the multiple can de-rate further toward the low end of analyst targets. Off-price retail is a resilient, share-gaining model, but Burlington's premium valuation leaves little room for disappointment, which is why a single decelerating quarter produced an outsized reaction.
What do analysts think of Burlington stock?
They remain constructive but are trimming numbers. Of 18 analysts, 13 rate Burlington a buy-equivalent and 5 a hold, giving it a Buy consensus with an average 12-month target near $365 — about 40% above the post-drop price — and a wide range from $290 to $440. On August 31, Goldman Sachs' Brooke Roach kept a Buy but cut her target to $382 from $394, and Deutsche Bank's Krisztina Katai reiterated a Hold and cut to $323 from $367; days earlier, UBS's Jay Sole had reiterated a Street-high $440. Lower targets alongside mostly unchanged ratings signal that analysts see a slower quarter, not a broken story.