Semiconductors
Applied Materials (AMAT) Stock: Why a Record Q3 Sold Off on Valuation and Growth — Then Rebounded
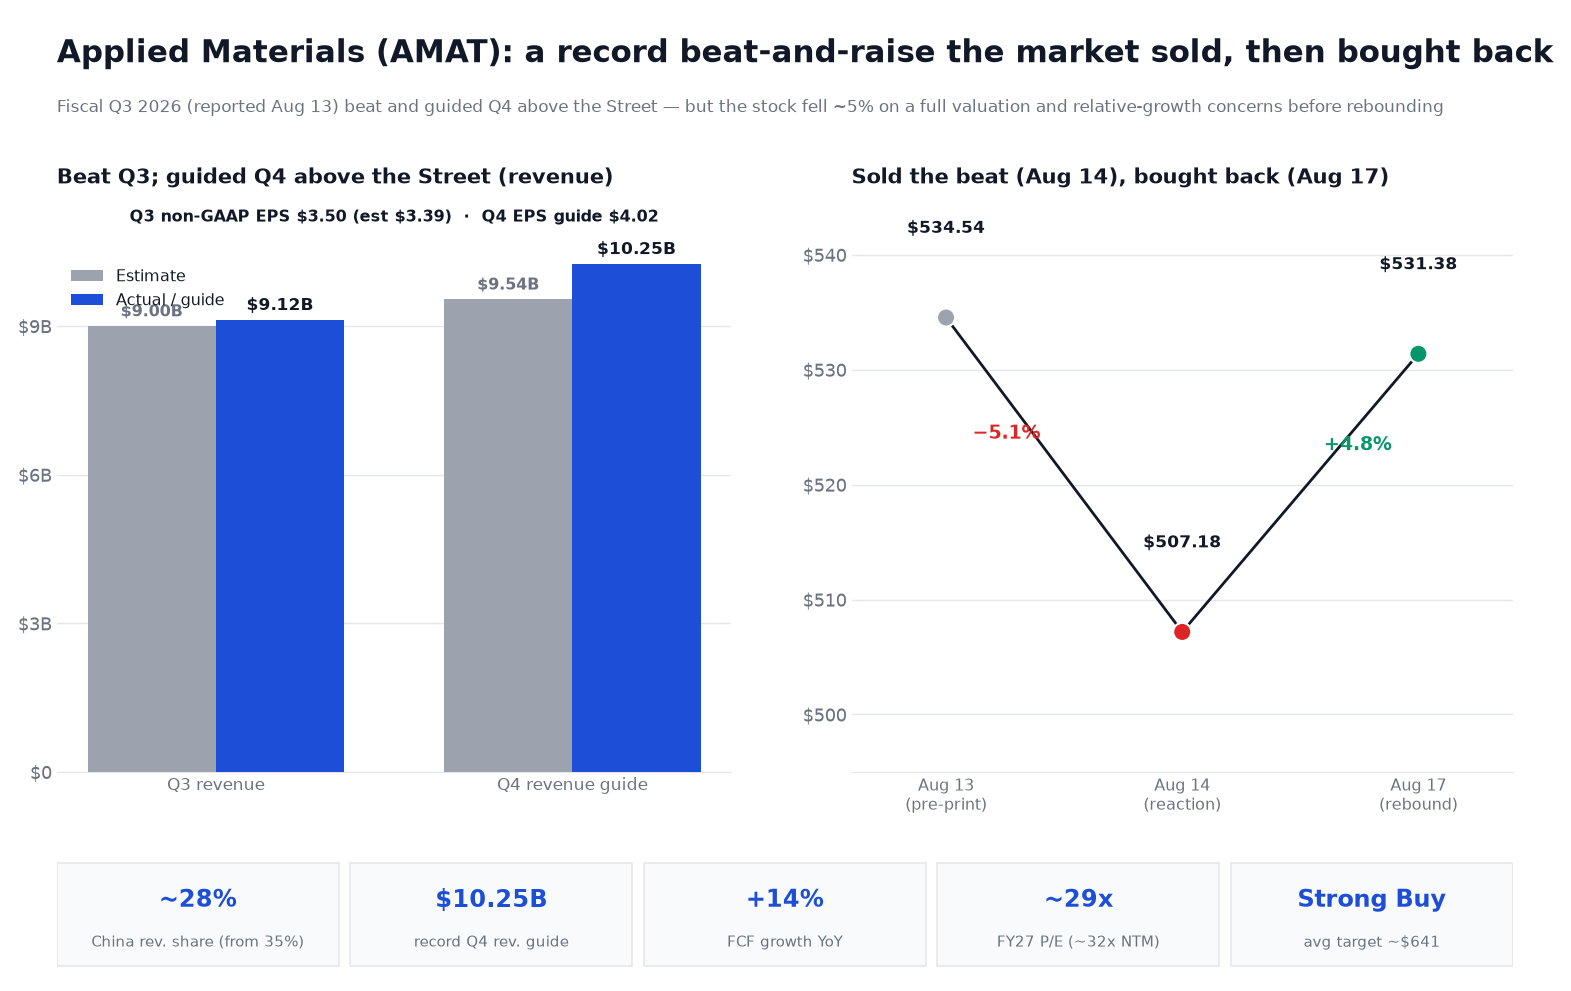
Applied Materials reported a record fiscal Q3 after the close on August 13 — revenue up 25% to $9.12 billion, non-GAAP EPS up 41% to $3.50, and Q4 guidance of $10.25 billion above the Street — yet the stock fell about 5% on August 14 before rebounding ~4.8% on August 17. The selloff was about a stock that had more than doubled in 2026 to an elevated multiple, a print that looked less exceptional than faster-moving peers Lam and ASML, and a flat near-term margin guide; China's declining revenue share was a background risk (dollars were roughly flat and management expects growth in 2026). The analyst reaction kept ratings broadly constructive with mixed target changes, and the consensus is a Strong Buy with a ~$641 average target.
Why Applied Materials stock sold its record quarter, then rebounded
After the close on Wednesday, August 13, 2026, Applied Materials (NASDAQ: AMAT) reported a record fiscal third quarter and guided the next quarter above Wall Street — and the stock fell about 5.1% the next day, from roughly $534.54 to a $507.18 close (down as much as ~6% pre-market) [1][2]. By Monday, August 17, the reaction reversed: as this was written that morning, AMAT was back up about 4.8% to around $531, partially undoing the drop [2]. A beat with an above-consensus guide that still gets sold is a puzzle worth unpacking — and the answer is less about the quarter than about the price the stock carried into it, how its growth stacks up against its peers, and a near-term margin guide.
Applied Materials is one of the world's largest semiconductor-equipment suppliers — it makes the deposition, etching, ion-implantation and inspection tools chipmakers use to build chips. As a broad "picks and shovels" supplier to foundry, logic and memory manufacturers, it is a bellwether for semiconductor capital spending, and the stock had priced in a lot: it entered the print having more than doubled in 2026 (up ~108%), at an unusually elevated earnings multiple [3]. When a stock is priced that richly, a strong-but-not-flawless print can still disappoint.
The scorecard: a record quarter, an above-Street guide, a few soft spots
On the headline numbers, the quarter was excellent and the outlook stepped up [1]:
- Revenue $9.12 billion, up about 25% year over year (and 15% sequentially — the highest quarter-over-quarter growth in company history), above the ~$9.0 billion consensus; non-GAAP EPS of $3.50 (GAAP EPS $3.17), up 41% year over year, beat the $3.39 estimate [1][4].
- Non-GAAP gross margin of 50.4%, up about 150 basis points year over year, with the Semiconductor Systems segment at a record $7.0 billion (up 27%) and a 55.4% non-GAAP segment gross margin [1].
- Q4 guidance issued above the Street: revenue of $10.25 billion, plus or minus $500 million (versus the ~$9.54 billion estimate), with non-GAAP EPS of about $4.02. Management also raised its calendar-2026 Semiconductor Systems growth outlook — from more than 20% earlier in the year to more than 30%, and now "greater than that" — which is the "raise" behind the beat-and-raise framing [1][4].
- Record operating cash flow of $3.04 billion; free cash flow of $2.33 billion, up about 14% year over year even as capital spending rose to $707 million from $584 million; and $860 million returned to shareholders ($440 million of buybacks, $420 million of dividends) [1].
So why sell it? Three soft spots gave a richly valued stock a reason. First, how the print looked against its peers: on the day, Summit Insights flagged that Applied's top line had lagged ASML and Lam, and Morgan Stanley called the results good but not exceptional relative to other equipment reports — strong, but not remarkable enough to stand out in a group where several names are firing [4][7]. Second, a flat near-term margin guide: management guided gross margin roughly flat sequentially, citing ramp costs from hiring and training service and semiconductor resources plus an increased Display mix [1]. Third, China — a background risk more than a headline: its share of revenue eased to 28% from 35% a year earlier, though that mostly reflects fast growth elsewhere (in dollars, China revenue was roughly flat, about $2.5 billion), and management said it expects China revenue to grow in 2026 [1]. Put together, the published beat simply was not large enough to clear the elevated expectations embedded after the stock's run.
Why a strong print got sold — and why it bounced
The rebound was consistent with Friday's decline being treated as an expectations reset rather than a deterioration in demand. Applied cleared consensus on revenue, EPS, margin and its guide; what it did not do was look exceptional against its peers, into a stock that had more than doubled year to date [4]. The China share decline and the flat-margin guide added reasons for profit-takers, but neither changed the core story: AI-driven investment in leading-edge logic, DRAM and advanced packaging is pulling semiconductor-equipment demand higher, which is why Applied could guide Q4 to $10.25 billion and lift its 2026 growth outlook [1]. Monday's move partially reversed the selloff as that outlook — and a share price still well below the Street's average target — reasserted themselves.
Why it matters
Applied Materials is one of the clearest reads on how much chipmakers are spending to build capacity, because foundry, logic and memory manufacturers all buy its tools. A record quarter and an above-Street guide say that spending is still strengthening; the relative-growth question asks whether Applied captures as much of it as faster-growing peers; and the margin guide shows the near-term cost of ramping to meet demand. Its swing captured all of that. The same read-through runs across the semiconductor supply chain, from the memory makers whose capital budgets drive Applied's orders — see Micron and SanDisk — to the tools that build their chips.
How the peers and sector traded the same day
As the largest name to report, Applied set the tone for the wafer-fab-equipment group on August 14, but its own drop was the biggest — which points to a company-specific setup rather than a sector-wide problem [7]:
| Name (ticker) | Aug 14, 2026 move | Read-through |
|---|---|---|
| AMAT — Applied Materials | ≈−5.1% | Its own print: an above-Street guide sold on valuation, relative growth and a flat-margin outlook [1] |
| KLAC — KLA Corporation | ≈−2.7% | Process-control peer; read-through from AMAT's print [7] |
| LRCX — Lam Research | ≈−1.4% | Etch/deposition peer; smaller decline, faster growth profile [7] |
The peers softened on Applied's report but fell far less than AMAT did — consistent with the reading that Applied's larger drop reflected its own valuation and the sense that its growth looked less exceptional than faster-growing names in the same group, rather than a change in the demand picture [7].
What the Street did with it
The analyst reaction kept ratings broadly constructive, but the target changes were mixed [5]. J.P. Morgan raised its target to $660 from $515 and RBC also raised (to $600, Outperform), while Morgan Stanley (~$642, Equalweight), Deutsche Bank ($605), B. Riley ($700) and UBS ($675, from $705) trimmed theirs — most keeping Buy or Outperform ratings [5]. The stock carries a consensus "Strong Buy" across roughly 39 analysts with an average target near $641 — well above the ~$531 price [6]. The debate is not whether demand is strong; it is whether a bellwether at a premium multiple, whose print looked less exceptional than some peers', has already priced the up-cycle.
What to watch
- Relative growth versus peers. The market's sharpest question this quarter was whether Applied's results keep pace with fast-moving peers like Lam and ASML; watch order and segment commentary for whether it stands out or lags [4][7].
- Gross-margin path. The near-term guide is roughly flat on ramp costs and Display mix; watch whether margin re-expands as those costs normalize [1].
- China revenue. China's share fell to ~28% from ~35%, but management expects the dollar figure to grow in 2026; watch whether that holds under export controls, since it is the biggest swing factor in the bear case [1].
- Cash flow and capital return. Free cash flow grew 14% despite higher capex; watch the free-cash-flow trend as capex declines as a share of revenue and the pace of buybacks and dividends. Moves are tracked on the AMAT stock page and the earnings calendar [1].
Illustrative valuation sensitivity
The scenarios below are a descriptive, author-weighted exercise — not a forecast, target, recommendation, or intrinsic fair-value calculation. Each price is expressed as a multiple of Applied's roughly $17.91 of fiscal-2027 consensus earnings (per StockAnalysis/S&P Global) to keep it concrete [3]. The weights are the author's subjective assumptions, anchored loosely to the analyst target distribution (consensus ~$641) [6]. The central inputs are Applied's growth relative to peers and the durability of the AI-driven equipment cycle. The percentages are illustrative and sum to 100%.
| Scenario | Illustrative price | Weight | Key drivers |
|---|---|---|---|
| Upside | ~$720 (≈40x FY2027 EPS) | 30% | The equipment up-cycle extends, Applied keeps pace with faster-growing peers, and gross margin re-expands past the ramp-cost headwind — toward the 52-week-high area [1][2]. |
| Middle | ~$620 (≈35x FY2027 EPS) | 45% | The guide is delivered and demand stays strong, but the relative-growth gap and a full valuation keep the multiple in check, holding the stock near the consensus target — above today's price [1][6]. |
| Downside | ~$400 (≈22x FY2027 EPS) | 25% | The equipment cycle rolls over, China revenue slips under tighter controls, or margins stay pressured, and the multiple de-rates as investors reprice cyclicality [3]. |
Weighting those (0.30 × $720 + 0.45 × $620 + 0.25 × $400) gives an author-weighted scenario value near $595, above the ~$531 quote and below the ~$641 consensus target [2][6]. The point is the width of the band, from the low-$400s to the 52-week high: a bellwether at ~29x fiscal-2027 earnings is highly sensitive to the two things that moved it this week — its growth relative to peers and the durability of the AI-equipment cycle. This is descriptive analysis of a corporate event, not investment advice.
AMAT data snapshot — August 17, 2026 (intraday, session open)
| Figure | Value | As-of / source |
|---|---|---|
| Earnings reaction | ≈−5.12% ($534.54 → $507.18) | Fri, Aug 14 — Q3 reported after close Aug 13; pre-market as much as ~−6% [2] |
| Intraday quote | $531.38 (+$24.20, +4.77%) | Aug 17, ~10:08 a.m. ET — StockAnalysis [2] |
| Day's range (Aug 17) | $515.12 – $533.34 (prior close $507.18) | Aug 17 session, still open [2] |
| 52-week range | $154.47 – $739.67 (up ~108% in 2026 into the print) | As of Aug 17 [2][3] |
| Market cap | ≈$421.9B (793.96M shares) | Aug 17 — StockAnalysis [2] |
| Valuation | ≈46x trailing GAAP (TTM GAAP EPS ≈$11.60); ≈29x FY2027 consensus (≈32x next-12-month); dividend yield ≈0.40% ($2.12, ex-date Aug 20) | Aug 17 — StockAnalysis / LSEG [3] |
| Q3 FY2026 results | Revenue $9.12B (+25% YoY); non-GAAP EPS $3.50 (GAAP $3.17); non-GAAP gross margin 50.4%; China ≈28% of total revenue (from 35%) | Reported Aug 13 — company release [1] |
| Cash flow / returns | Record operating cash flow $3.04B; free cash flow $2.33B, +14% YoY (capex $707M); $860M returned ($440M buyback + $420M dividends) | Q3 FY2026 — company release [1] |
| Q4 guidance | Revenue $10.25B ± $500M (vs ~$9.54B est); non-GAAP EPS ≈$4.02; 2026 Semi Systems growth outlook lifted to ">30%+" | Aug 13 — company release [1] |
| Analyst reaction | Mixed targets, constructive ratings — JPM $660 (from $515) and RBC $600 raised; MS $642 (EW), DB $605, B. Riley $700, UBS $675 (from $705) trimmed. Consensus Strong Buy, avg ≈$641 (~39 analysts) | Aug 2026 — StockAnalysis / market coverage [5][6] |
The August 17 figures are intraday snapshots that moved through the session, not closing prices; the $507.18 August 14 figure is a settled close.
The setup at a glance
| Question | Answer |
|---|---|
| What happened? | Applied Materials reported a record fiscal Q3 after the close on Aug 13 (revenue $9.12B, +25%; non-GAAP EPS $3.50) and guided Q4 above the Street to a record $10.25B — yet the stock fell ~5% on Aug 14, then rebounded ~4.8% on Aug 17 [1][2]. |
| Why did a strong print fall? | The stock had more than doubled in 2026 to an elevated multiple; its print looked less exceptional than Lam and ASML; and it guided gross margin roughly flat near term on ramp costs — so a strong-but-not-exceptional print couldn't clear the raised bar [1][4]. |
| Is China a problem? | It is a background risk, not a collapse: China's revenue share fell to ~28% from ~35%, but that mostly reflects faster growth elsewhere (China dollars were roughly flat, ~$2.5B), and management expects China to grow in 2026 [1]. |
| Why did it bounce back? | The market re-weighted a record above-Street guide, a lifted 2026 growth outlook, free cash flow up 14%, and a price still ~20% below the consensus target [1][6]. |
| Was it a sector move? | Partly — Applied's report set the tone (KLA ≈−2.7%, Lam ≈−1.4%) — but AMAT's ~5% drop was the largest, reflecting its own valuation and relative-growth setup [7]. |
| What do analysts think? | Ratings stayed broadly constructive, but target changes were mixed — J.P. Morgan and RBC raised, while Morgan Stanley, Deutsche Bank, B. Riley and UBS trimmed. Consensus Strong Buy, average target ~$641 [5][6]. |
Applied Materials (AMAT) stock FAQ
Why did Applied Materials (AMAT) stock fall after Q3 2026 earnings?
Applied Materials reported a record fiscal Q3 after the close on August 13 — revenue up about 25% to $9.12 billion (above the ~$9.0 billion consensus), non-GAAP EPS up 41% to $3.50, and it guided Q4 to $10.25 billion, above the Street — yet the stock fell about 5% on August 14 (from roughly $534.54 to $507.18). The selloff was a valuation and expectations reaction: the stock had more than doubled in 2026 to an elevated multiple, its print looked less exceptional than faster-moving peers Lam Research and ASML, and management guided gross margin roughly flat near term on ramp costs and Display mix. China's declining revenue share was a background risk. The analyst reaction kept ratings broadly constructive, though target changes were mixed.
Why did AMAT stock rebound on August 17?
By Monday, August 17, the stock recovered about 4.8% to around $531, partially reversing Friday's decline. The initial profit-taking gave way to the fundamentals: Applied guided Q4 to a record $10.25 billion, lifted its calendar-2026 semiconductor-systems growth outlook to more than 30%, generated record operating cash flow of $3.04 billion with free cash flow up 14%, and its share price was still about 20% below the Street's average target near $641. Once the sell-the-news reaction cleared, buyers stepped back in.
How big is Applied Materials' China exposure, and is it shrinking?
China was about 28% of Applied's total revenue in fiscal Q3 2026, down from about 35% a year earlier. But the decline is mostly a share effect, not a shrinking business: in dollar terms, China revenue was roughly flat (around $2.5 billion), and the share fell because revenue elsewhere grew quickly. Management said it expects China revenue to grow in calendar 2026. U.S. export controls remain a real structural overhang and the biggest swing factor in the bear case, but the quarter did not show a collapsing China business.
Is Applied Materials stock expensive after the run?
It is priced for a strong up-cycle. AMAT trades at roughly 46x trailing GAAP earnings (about $11.60 of trailing GAAP EPS) and about 29x its fiscal-2027 consensus earnings — roughly 32x on a standard next-12-month basis — after rising around 108% in 2026. That multiple is demanding but not unusual for a leading equipment supplier during an AI-driven capital-spending boom, and the company just guided Q4 to record revenue. The risk is that its results looked less exceptional than faster-moving peers and the semiconductor-equipment cycle is cyclical. Analysts still rate it a consensus Strong Buy with an average target near $641, about 20% above the price. This is descriptive analysis, not investment advice.
What does Applied Materials do?
Applied Materials is one of the world's largest suppliers of semiconductor manufacturing equipment — the deposition, etching, ion-implantation, and inspection and measurement tools that chipmakers use to build semiconductors. It sells to foundry, logic and memory manufacturers such as TSMC, Intel, Samsung and the memory makers, which makes it a broad 'picks and shovels' bellwether for how much the industry is spending to build chip capacity, including for AI. Its fiscal year ends in late October, so its fiscal third quarter covers roughly the May–July period.