Stock Analysis
Why did Axon (AXON) stock rebound on August 7, 2026? A 14% post-earnings drop the sell side kept raising targets into
AXON traded up 7.66% at $562.50 by 1:53 p.m. ET, recovering 46% of Thursday's $87.03 decline. The striking detail is what the sell side did while the stock fell 14.28%: Barclays, Goldman Sachs, Piper Sandler, Morgan Stanley and UBS all raised targets on August 6, and nobody downgraded. Revenue grew 35.3% and guidance went up. Earnings per share fell 13.8% — but mostly against a prior-year tax benefit, which leaves the guided margin trough, still ahead, as the durable concern.

Summary
Axon Enterprise, Inc. (NASDAQ: AXON) traded at $562.50, up $40.04 or 7.66% from Thursday's $522.46 close as of 1:53 p.m. ET on Friday, August 7, 2026 [1]. The session was still open at publication. Every August 7 figure in this article is an intraday reading taken between 1:53 and 1:57 p.m. ET; nothing here is a close.
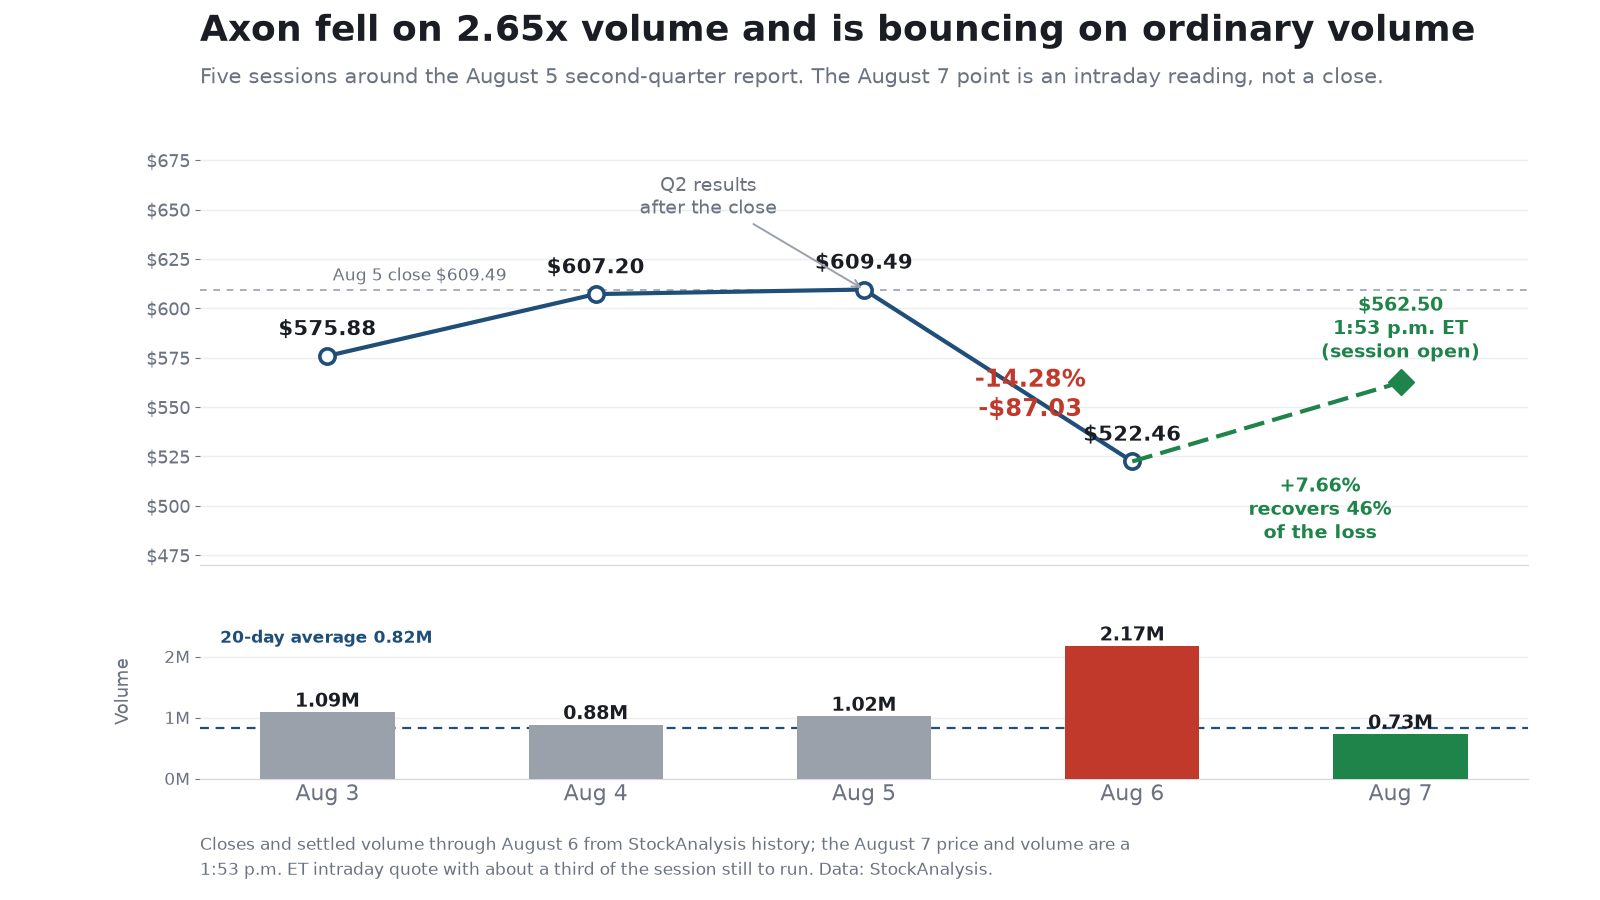
The rebound follows the worst session in Axon's recent record. On Thursday, August 6 — the first full session after second-quarter results landed after the close on Wednesday, August 5 — the stock fell 14.28% to $522.46, on 2,174,075 shares against a 20-day average of 820,185 as displayed at the 1:53 p.m. ET snapshot [2][3][15]. On roughly 80.60 million shares outstanding, that removed about $7.0 billion of market value in one day [3].
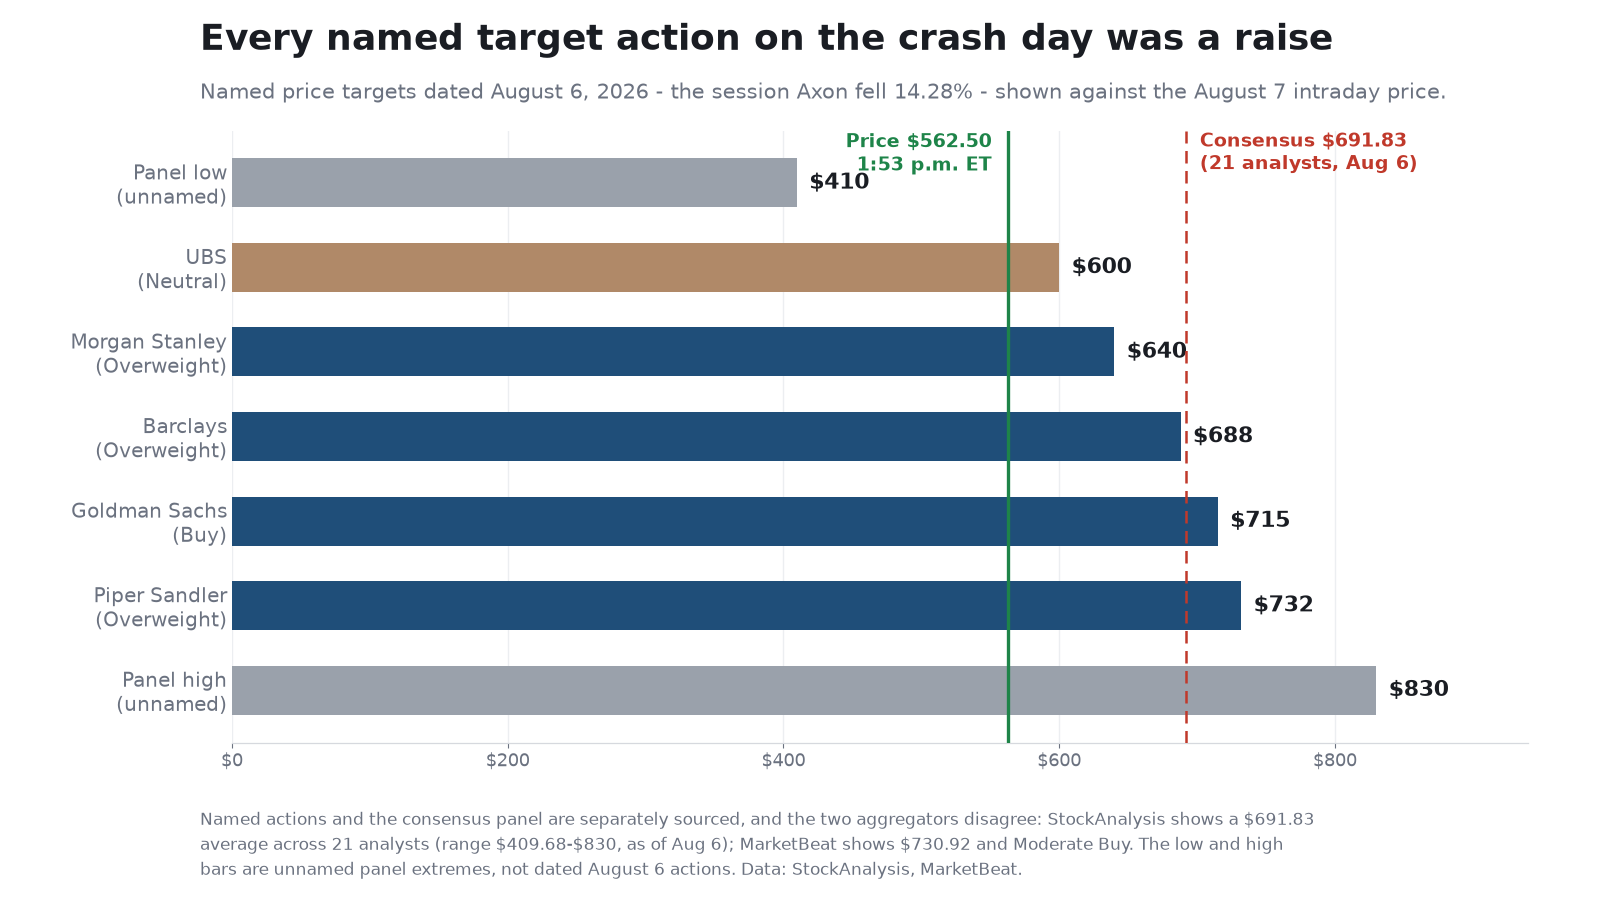
The most useful fact about that decline is what the sell side did during it. Every named analyst action responding to the print is dated August 6 — the day the stock fell — and every one was a price-target raise or a reiterated buy-equivalent rating [8]. Barclays took its target to $688 from $523. Morgan Stanley went to $640 from $600. UBS moved to $600 from $440 while still rating the stock Neutral. Nobody downgraded. That combination — a 14% decline into a set of raised targets — is what makes the simple reading implausible. The pattern is consistent with investors repricing the timing and durability of profit conversion rather than Axon's top-line growth, though a single session's tape cannot identify any individual seller's reason.
No fresh Axon-issued catalyst explains Friday. No company announcement, filing, contract or rating change is dated August 7, and this site's own change-event record for the session reaches the same conclusion [16]. Third-party Axon-related headlines did appear — an aggregator published a 13F-based item on August 7 reporting that Pacer Advisors had sold 178,124 shares, a backward-looking holdings disclosure rather than an operating development [17]. The stock has recovered $40.04 of the $87.03 it lost — 46% of the decline — on volume running near, not far above, normal [1][2].
Axon stock timeline: Q2 results to the rebound
| When | What happened |
|---|---|
| Wed Aug 5, after the close | Q2 2026 results: revenue $904.4m (+35.3%), FY growth guidance raised to 32–34% from 30–32%, non-GAAP EPS $1.88 against $2.18 a year earlier [4][15] |
| Thu Aug 6, pre-market | Five named price-target raises (Barclays, Goldman Sachs, Piper Sandler, Morgan Stanley, UBS) plus a Needham rating reiteration [8] |
| Thu Aug 6, session | Opened $589.15, rose to a $628.22 high — above the prior close — then fell to a $516.15 low and settled at $522.46, down 14.28% on 2,174,075 shares [2] |
| Fri Aug 7, 1:53 p.m. ET | $562.50, up 7.66%, recovering 46% of the decline on 729,760 shares; no fresh Axon-issued catalyst identified [1][16] |
What did Axon actually report?
The second quarter, released after the close on Wednesday, August 5, beat on revenue and raised the full-year outlook [4]:
| Measure | Q2 2026 | Year over year | Note |
|---|---|---|---|
| Total revenue | $904.4m | +35.3% | +4.1% vs Zacks' ~$868.4m; +3.2% vs FactSet/IBD's ~$876.4m |
| Software & Services revenue | $398m | +36% | gross margin 71.3% (adj. 75.1%) |
| Connected Devices revenue | $507m | +35% | gross margin 51.9% (adj. 53.4%) |
| of which TASER | $261m | — | — |
| of which Personal Sensors | $95m | — | — |
| of which Platform Solutions | $150m | — | includes Dedrone |
| Total gross margin | 60.4% | flat | adjusted 62.9%, down 40bps |
| Adjusted EBITDA | $242m | — | 26.8% margin |
| GAAP net income | $29m | — | $0.36 diluted |
| Non-GAAP diluted EPS | $1.88 | −13.8%, from $2.18 | the number that mattered — but see the tax note below |
| Non-GAAP net income | $155m | from $178.8m | −13.3% |
| Annual recurring revenue | $1.639bn | +39% | net revenue retention 126% |
| Future contracted bookings | $15.1bn | +41% | — |
| Operating cash flow | $20m | from -$92m | free cash flow ~breakeven |
| FY26 revenue growth guidance | 32–34% | raised from 30–32% | — |
| FY26 adj. EBITDA margin guidance | 25.5% | — | — |
Three notes belong with that table before anyone calls the quarter a beat or a miss.
First, the earnings comparison comes from Axon's own release, not from a compiler: non-GAAP diluted EPS of $1.88 against $2.18 in the second quarter of 2025, a 13.8% decline, on non-GAAP net income of $155m against $178.8m [4]. Where compilers differ is on the forward consensus, and that disagreement is real: one puts it at $1.84, which makes $1.88 a slight beat; another puts it at $1.89, which makes it a slight miss [6][7]. This article calls the quarter neither an EPS beat nor an EPS miss.
Second — and this is the part most of the coverage skipped — the release states why earnings per share fell: pre-tax income increased year over year, and the per-share decline came primarily from a large tax benefit recognised in the prior-year quarter [4]. That materially changes what the number means. A headline "EPS down 13.8%" reads as deteriorating profitability; a pre-tax line that grew against a prior-year tax benefit is a comparison artefact. Any reading of August 6 has to sit with the fact that the most-quoted bearish figure of the quarter is substantially an artefact of the base period — which makes the guided margin path, not the EPS print, the durable concern.
Third, the revenue beat depends on whose consensus you use: +4.1% against Zacks' ~$868.4m, +3.2% against FactSet's and IBD's ~$876.4m [7]. Neither is "the" consensus.
The internal arithmetic checks out. Software & Services of $398m plus Connected Devices of $507m reconciles to the $904.4m total within rounding, and the three product lines — TASER $261m, Personal Sensors $95m, Platform Solutions $150m — sum to $506m against the $507m device line [4].
Why did a raised guide produce a 14% decline?
Because the direction of earnings inverted the direction of revenue, and at Axon's multiple there is no room for that.
The company grew revenue 35.3%, lifted full-year growth guidance by two points at both ends, and reported annual recurring revenue up 39% with $15.1 billion of contracted bookings [4]. Against that, adjusted earnings per share fell 13.8% — mostly on the prior-year tax benefit rather than on operations — adjusted gross margin slipped 40 basis points, and free cash flow was approximately breakeven for the quarter because of inventory investment [4][5]. Chief financial officer Brittany Bagley told the call that the third quarter's adjusted EBITDA margin would "reflect the impact of those memory costs with no benefit from tariff refunds," and that margins would then "scale back in Q4 to these levels to hit our full-year target" of 25.5% [5].
Read that guidance structurally rather than as a single quarter of noise. Management is telling investors the margin trough is ahead, in the third quarter, and that the full-year 25.5% target depends on a fourth-quarter recovery that has not happened yet. A company trading at 233.9 times trailing earnings and 62.5 times forward earnings is priced for compounding profit, and it has just guided to a quarter in which profit gets worse before it gets better [1][3].
The cost line Axon named is checkable elsewhere. Management identified semiconductor memory costs as the third-quarter margin headwind, and the same input cost that drove the derating debate at Micron from the supplier side now shows up at Micron's customers, and at Axon it lands on the device line. A hardware-plus-software company with 51.9% device gross margins absorbs memory inflation directly; the 71.3%-margin software line does not offset it in the quarter it lands.
The single sharpest fact about August 6 is that the market did not decide this immediately. The stock opened at $589.15, traded as high as $628.22 — 3.07% above the prior close — and then fell to a low of $516.15 before settling at $522.46 [2]. That is a peak-to-trough range of $112.07, or 17.8% of the session's high, inside one day. The first read of the print was positive. The second was not.
How much of Friday's move was Axon, and how much was the market?
The broad market and the peer group cannot by themselves explain the magnitude, and the cleanest evidence is that the closest listed competitor went the other way.
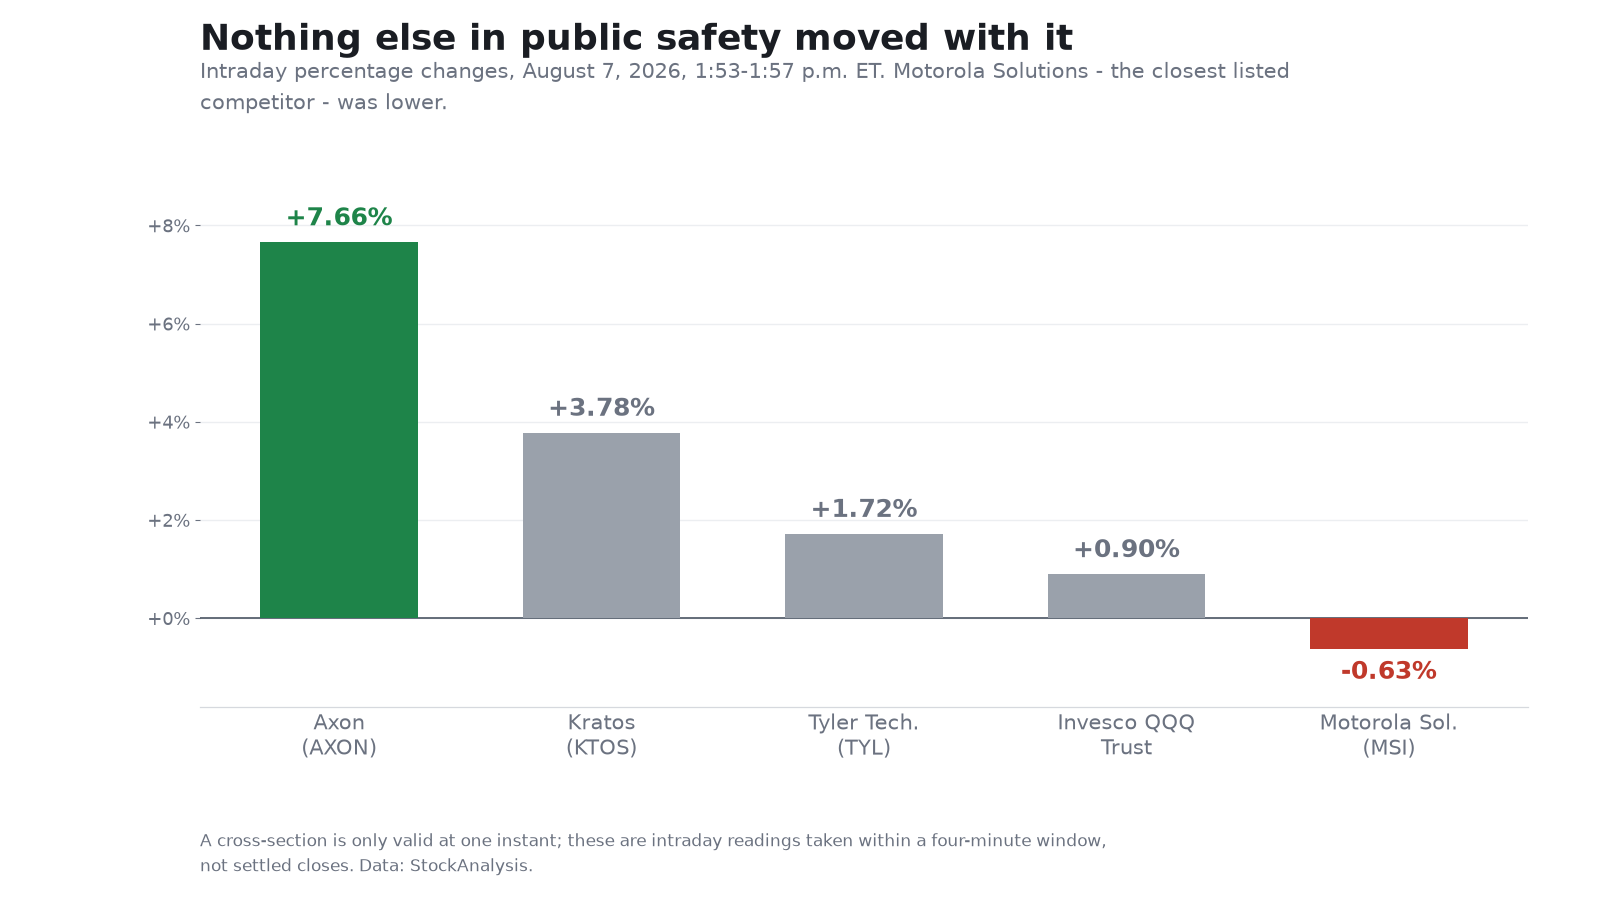
At 1:53–1:57 p.m. ET, Motorola Solutions was down 0.63% at $471.10, Tyler Technologies was up 1.72%, Kratos Defense — a counter-drone comparable for Axon's Dedrone line — was up 3.78%, and the Invesco QQQ Trust was up 0.90% [10][11][12][13]. Axon outperformed the Nasdaq-100 proxy by 6.76 percentage points and Motorola Solutions by 8.29 points.
Those gaps establish that the move was specific to Axon. They do not decompose it, and no decomposition is offered here: betas, liquidity, short interest and options positioning all differ between two stocks on the same day, and Kratos in particular carries its own defense-contract newsflow. What the cross-section rules out is a sector or index explanation.
The macro backdrop is dateable and modest in size. July non-farm payrolls, released at 8:30 a.m. ET, showed employment falling by 23,000 against an expected gain of about 83,000, with unemployment at 4.1% and the ten-year Treasury yield down five basis points to 4.63% [14]. The live policy question in August 2026 is whether the Federal Reserve hikes in September; a soft print reduces those expectations. For a stock at 62.5 times forward earnings, a lower expected path for rates is not a rounding error — but the broad market moved less than one percent on it, so it cannot account for 7.66%.
How heavy was the volume?
Ordinary — and that is the point of the section, so the arithmetic needs its clock attached.
By 1:53 p.m. ET, 263 of the session's 390 minutes had elapsed — 67.4% — and 729,760 shares had traded [1]. The 20-day average for a full session was 820,185 as displayed at that same 1:53 p.m. ET snapshot — a rolling, vendor-dependent statistic rather than a fixed historical constant [3]. So the rebound had done about 0.89 of a normal entire day's volume in roughly two-thirds of a day. That is not below-average participation; if anything it is slightly ahead of an average pace. But it is nothing like Thursday, when 2,174,075 shares traded — 2.65 times the 20-day average [2][3].
The asymmetry is the evidence. The decline was transacted on nearly three times normal turnover; the recovery, so far, on roughly normal turnover. That is consistent with a large repricing followed by a smaller, less broadly-supported retracement. It does not identify who was buying or selling on either day, and a single session's tape cannot. Short interest was modest on the latest reported data — 3.71 million shares, 4.84% of the 76.75 million free float — so the available evidence does not independently support a squeeze explanation. That figure is a settlement-date statistic with its own as-of lag, not a live August 7 reading, and establishing covering would require borrow, intraday short-sale and options data this article does not have [3].
Valuation scenarios
What follows is an illustrative weighted price-anchor exercise, not a valuation model and not a price forecast. The probabilities are the author's own illustrative weights, they sum to 100%, and each price is anchored to a published, dated figure rather than to a model.
| Scenario | Price anchor | Illustrative weight | Valuation basis | Conditions associated with it |
|---|---|---|---|---|
| High | ~$715 | 25% | Goldman Sachs's Aug 6 reiterated Buy target [8] | The Q3 memory-cost trough is one quarter deep as guided, Q4 margin recovers enough to hit the 25.5% full-year target, ARR keeps compounding near 39%, and the ~$450m full-year free-cash-flow target lands |
| Middle | ~$692 | 45% | StockAnalysis consensus average, 21 analysts, as of Aug 6 [9] | Revenue growth holds in the guided 32–34% band and the margin path is broadly as described, but the multiple stays compressed while adjusted EPS is still declining year over year |
| Low | ~$410 | 30% | The low of the same 21-analyst panel ($409.68) [9] | Memory-cost inflation persists past Q3, the 25.5% full-year EBITDA margin is missed, free-cash-flow conversion stays near breakeven on continued inventory build, and a 62.5x forward multiple derates further |
| Weighted | ~$613 | 100% | Author's weights | 9.0% above the $562.50 intraday price |
Three caveats belong with that table. The low anchor is a published analyst target, not a modelled downside, and at $409.68 Axon would still trade at roughly 45 times forward earnings on the vendor's current 62.5x at $562.50 — a derating, not a collapse [3]. The 30% weight on it is a judgement rather than a derivation: it reflects that the guided margin trough has not yet been reported, not a view that the panel low is likely. And the middle anchor is a consensus that a second aggregator puts $39 higher, so the blend would rise by roughly $18 on MarketBeat's figure instead [8][9]. The disagreement about this company is not about whether it grows. It is about what a 35%-growth, 26.8%-EBITDA-margin business with falling earnings per share is worth, and no target average resolves that.
Why it matters
The question Axon poses applies well beyond it: what happens to a premium-multiple compounder when the compounding shows up in bookings rather than in earnings?
The forward-looking metrics are unambiguous. Annual recurring revenue of $1.639 billion is growing 39%, net revenue retention is 126%, and future contracted bookings of $15.1 billion are up 41% — about 4.2 times revenue annualised at the second-quarter rate, an author-derived comparison against the $904.4m quarter rather than a company-stated ratio [4]. Those are the numbers the sell side is underwriting when it publishes a $692 average target against a $562.50 price.
The reported metrics point the other way in the near term. Adjusted EPS fell year over year, adjusted gross margin narrowed, free cash flow was roughly breakeven, and the guided third quarter is worse before it is better [4][5]. The stock is about 36% below its high of the past year and down 35.0% over the past twelve months, so this is not a name the market has been giving the benefit of the doubt [1][3]. That drawdown figure is window-sensitive and worth stating precisely: one vendor shows a $885.00 high, against which $562.50 is 36.4% below, while another shows $878.62 on a strict rolling-52-week basis as of August 7, against which the same price is 36.0% below — the $885 print sits around the very edge of the window [1][20].
The contrast with Palantir earlier this week is instructive rather than decorative: that print delivered acceleration and operating leverage together, and the stock rose. Axon delivered the acceleration without the leverage. On a 62.5x forward multiple, the market treated those two outcomes very differently.
What to watch
The third-quarter adjusted EBITDA margin. This is the single number the article turns on. Management has guided it down explicitly on memory costs with no tariff-refund offset [5]. Meeting the guided trough would support the temporary-pressure reading, though whether $522.46 was an overshoot also depends on growth, bookings, cash flow and the multiple at the time. Coming in below it would stop the low scenario being a panel artefact.
Whether the full-year 25.5% target survives. The company has committed to a fourth-quarter margin recovery sufficient to hit 25.5% for the year [4][5]. That is a testable claim with one quarter of runway. Watch whether the FY target is reaffirmed alongside the Q3 print or quietly widened.
Free cash flow against the ~$450m full-year target. Q2 produced roughly breakeven free cash flow on $20m of operating cash flow, with management attributing the gap to inventory investment it expects to moderate after this year [5]. A full-year target of about $450m implies a substantial second-half conversion. Watch the inventory line beside the cash flow statement, not the cash flow statement alone.
Whether adjusted EPS stops going backwards. Revenue growth of 35% was never the problem. A second consecutive quarter of declining adjusted earnings per share against 30%-plus revenue growth would strengthen the case that the pressure is persisting beyond a one-quarter trough — particularly if it comes without the prior-year tax-benefit distortion that drove most of this quarter's decline [4].
The next analyst actions, and their direction. Six firms raised or reiterated into a 14% decline [8]. If the panel starts converging downward toward the $409.68 low rather than sitting near the $691.83 average, that shift — not the current level — is the signal [9].
Frequently asked questions
Why did Axon stock rebound on August 7, 2026?
No fresh Axon-issued operating, financial, contract or analyst catalyst was identified as of publication, and BestStocks' own change-event record for the day reaches the same conclusion. Third-party Axon-related headlines did appear — an aggregator ran a 13F-based item on August 7 about Pacer Advisors selling 178,124 shares — but that is backward-looking holdings coverage, not a company development. Axon traded at $562.50, up 7.66%, as of 1:53 p.m. ET, recovering 46% of the $87.03 it lost the previous session, on roughly normal turnover: about 0.89 of a full 20-day-average session with two-thirds of the day elapsed, against 2.65 times average volume on the way down.
Why did Axon stock fall 14% after beating on revenue?
The strongest company-specific explanation is that earnings moved in the opposite direction from revenue. Second-quarter revenue grew 35.3% to $904.4 million and full-year growth guidance was raised to 32–34% from 30–32%, but non-GAAP diluted EPS fell 13.8% year over year, from $2.18 to $1.88, adjusted gross margin narrowed 40 basis points and free cash flow was approximately breakeven. Axon's release notes that pre-tax income actually rose and the per-share decline came primarily from a large prior-year tax benefit, so the more durable concern is the guided third-quarter margin: management flagged semiconductor memory costs with no repeat of Q2's tariff refunds. At 233.9 times trailing and 62.5 times forward earnings, a guided margin trough leaves no cushion. A one-day tape cannot prove a single cause.
Did analysts downgrade Axon after the Q2 2026 results?
No. Five named target actions are dated August 6 — the session the stock fell 14.28% — and every one was a raise: Barclays to $688 from $523, Goldman Sachs to $715 from $535, Piper Sandler to $732 from $724, Morgan Stanley to $640 from $600, and UBS to $600 from $440 while still rating the stock Neutral. Needham also reiterated Buy that morning, though its $750 target was set on July 6 and is not a post-earnings mark. Because these actions are dated the day before the rebound, they are evidence about the decline rather than an explanation of the August 7 move.
What is the analyst price target for Axon stock?
The two aggregators disagree, and the gap is worth knowing. StockAnalysis shows an average target of $691.83 across 21 analysts with a range of $409.68 to $830.00, last updated August 6, 2026. MarketBeat shows $730.92 and a Moderate Buy consensus. Against a $562.50 intraday price on August 7, those averages imply roughly 23% and 30% upside respectively. The $39 spread between compilers is itself a caution against treating any single consensus figure as precise.
Was Axon's move on August 7 part of a wider sector rally?
Not explained by the broad market alone. At the same 1:53–1:57 p.m. ET timestamp, Motorola Solutions — the closest listed public-safety comparable — was down 0.63%, Tyler Technologies was up 1.72%, Kratos Defense was up 3.78% and the Invesco QQQ Trust was up 0.90%. Axon outperformed the Nasdaq-100 proxy by 6.76 percentage points and Motorola Solutions by 8.29 points. That leaves a large idiosyncratic residual, but it does not prove sector or macro forces contributed nothing, and it is not a decomposition of the move.
What should investors watch next on Axon?
The third-quarter adjusted EBITDA margin is the number the whole debate turns on, because management has already guided it down on memory costs. Beyond that: whether the 25.5% full-year adjusted EBITDA margin target is reaffirmed with the Q3 print, whether free cash flow converts toward the roughly $450 million full-year target after a breakeven second quarter, whether earnings per share stop falling once the prior-year tax-benefit distortion drops out of the comparison, and whether the analyst panel starts converging downward toward its $409.68 low rather than sitting near its $691.83 average.