Stock Analysis
Why did Palantir (PLTR) stock jump on August 4, 2026? A 149% U.S. commercial quarter — and the multiple that came with it
Palantir traded up 27.07% at $159.66 by 11:29 a.m. ET after second-quarter revenue grew 93% to $1.935 billion and U.S. commercial revenue grew 149%. Two disclosed lines ran far below that headline: international commercial revenue rose 2% sequentially, and closed contract value grew 49%.

Summary
Palantir Technologies Inc. (NASDAQ: PLTR) traded at $159.66, up $34.01 or 27.07% from Monday's $125.65 close as of 11:29 a.m. ET on Tuesday, August 4, 2026 [1][2]. The session was still open at publication, so every figure below is an intraday reading at one consistent timestamp, not a close. On roughly 2.40 billion shares outstanding, the advance had added about $81.5 billion of market value in under two hours of trading [1][3].
The cause is dated and documented [20]. After Monday's close Palantir reported second-quarter revenue of $1.935 billion, up 93% year over year, against consensus near $1.80–$1.81 billion, with adjusted earnings of $0.41 a share versus a $0.34–$0.35 consensus depending on the compiler [5][7][8]. U.S. commercial revenue grew 149% to $764 million, and the company raised full-year 2026 revenue guidance to $8.150–$8.158 billion — 82% growth, up from the 71% it had guided to previously [5][6][10]. Chief executive Alex Karp called the quarter "otherworldly" [7].
Two things are worth separating. The operating result is not ambiguous: revenue growth accelerated from 85% in the first quarter to 93% at a $1.9 billion quarterly base, which is unusual, and it did so alongside a 62% adjusted operating margin [5][10]. The market's reaction is a different question. This was also a strongly positive tape — the Invesco QQQ Trust was up 2.55% and the iShares Expanded Tech-Software ETF 3.79% at the same timestamp — and the price remains about 23% below its 52-week high of $207.52 even after a 27% morning [1][14][15]. The move restored the stock's range rather than extending it.
What did Palantir actually report?
The disclosed figures, all from the second-quarter release and the accompanying call [5][6][21]:
| Measure | Q2 2026 | Year over year | Sequential |
|---|---|---|---|
| Total revenue | $1.935bn | +93% | +19% |
| U.S. revenue | $1.573bn | +115% | +23% |
| U.S. commercial revenue | $764m | +149% | +28% |
| U.S. government revenue | $809m | +90% | +18% |
| International commercial revenue | $182m | +26% | +2% |
| International government revenue | $181m | +42% | +5% |
| Adjusted operating income | $1.194bn | 62% margin | — |
| GAAP operating income | $912m | 47% margin | — |
| GAAP net income | $1.062bn | — | — |
| Adjusted gross margin | 86% | — | — |
| Adjusted free cash flow | $1.220bn | 63% of revenue | — |
| Total contract value booked | $3.373bn | +49% | — |
| Total remaining deal value | $13.1bn | +83% | +11% |
| U.S. commercial remaining deal value | $6.238bn | +124% | +27% |
| Cash and short-term Treasuries | $9.2bn | — | — |
| Rule of 40 score | 155 | 93% growth + 62% margin | — |
The Rule of 40 score of 155 is simply 93% growth plus a 62% adjusted operating margin, so it adds no information to the two lines above it. What it does is make the combination legible. Growth and margin normally trade against each other; Palantir posted both at once and converted 63% of revenue into adjusted free cash flow [5]. The release also disclosed 220 deals of $1 million or more, 98 above $5 million and 73 above $10 million; no year-ago counts were given, so those establish scale rather than direction [7].
One presentational note. Both mirrors of the release report GAAP and adjusted diluted earnings per share at the same $0.41. That identity is hard to reconcile with the scale of Palantir's stock-based compensation, so only the adjusted figure is compared against consensus here, and the GAAP result is given as operating income and net income instead [5][6].
Guidance moved further than the quarter did. Full-year revenue went to $8.150–$8.158 billion from a prior guide implying roughly $7.65–$7.66 billion, and U.S. commercial revenue is now guided above $3.424 billion, at least 134% growth [5][6]. Third-quarter revenue is guided to $2.160–$2.164 billion, about 12% above the second quarter sequentially, and adjusted free cash flow for the year to $4.5–$4.7 billion [6].
What did the headline numbers not show?
Two lines in the same release ran well below the 93% headline, and neither was the focus of the reaction.
The first is international commercial revenue. Palantir disclosed it at $182 million, up 26% year over year and 2% sequentially, alongside international government revenue of $181 million, up 42% and 5% sequentially [21]. The sequential number is the striking one: the segment that is meant to demonstrate that the AI platform sells outside its home market moved 2% quarter on quarter, while its U.S. counterpart moved 28%. International revenue of $363 million combined is 19% of the total and grew about 33%. This quarter's acceleration is a U.S. story, and specifically a U.S. commercial one.
The second is bookings, and it needs all three measures rather than one. Total contract value booked in the quarter grew 49% — 44 percentage points below the revenue growth rate. But total remaining deal value ended the quarter at $13.1 billion, up 83% year over year and 11% sequentially, and U.S. commercial remaining deal value at $6.238 billion, up 124% and 27% sequentially [5][21]. The backlog measures sit close to the revenue line; the closed-TCV measure does not. That 27% sequential rise in U.S. commercial backlog against a 28% sequential rise in U.S. commercial revenue is a useful cross-check that the pipeline is keeping pace with what is being recognised. Closed TCV is the lumpiest of the three — a large government renewal landing in one quarter rather than another moves it several points — so the gap is a question to carry into the third quarter, not a conclusion to draw from one.
How much of the move was Palantir and how much was the market?
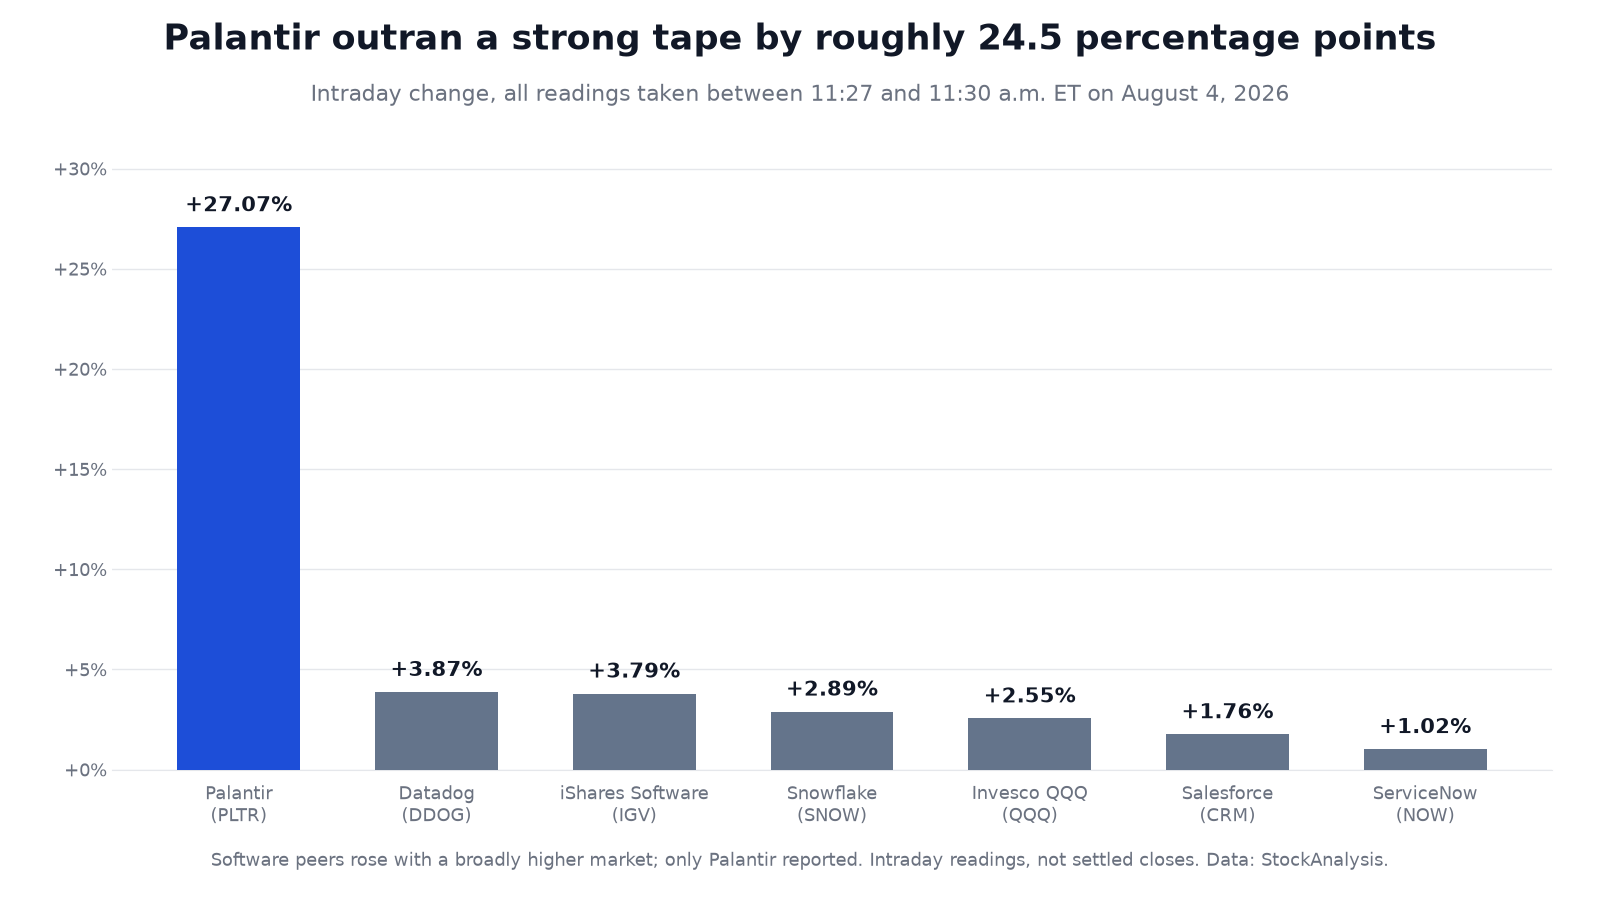
The tape was broadly strong. At the same timestamp the Invesco QQQ Trust was up 2.55%, the iShares Expanded Tech-Software ETF 3.79%, Datadog 3.87%, Snowflake 2.89%, Salesforce 1.76% and ServiceNow 1.02% [14][15][16][17][18][19]. Palantir was ahead of the Nasdaq-100 proxy by roughly 24.5 percentage points.
The software ETF comparison needs an adjustment the raw figure hides, because Palantir is itself 7.83% of IGV [22]. Its own 27.07% advance contributed about 2.1 points of the ETF's 3.79%, which implies the rest of the index rose roughly 1.8% and puts the company-specific gap nearer 25 percentage points than the 23.3 the headline figures suggest. That calculation uses the post-move weight, so it is approximate, but it moves in only one direction: the unadjusted sector comparison understates how far Palantir separated from its group.
Stating the excess in percentage points rather than as a multiple is deliberate: a ratio between two percentages is unstable when the denominator is small and would swing widely depending on which index proxy were chosen. What the cross-section supports is that a low-single-digit portion of the advance is attributable to conditions every software name shared, and the remainder is specific to the print. It does not support a precise decomposition, and none is offered.
Turnover was extraordinary and needs to be stated with its clock. By 11:29 a.m. ET, roughly 119 of the session's 390 minutes had elapsed — about 30% — and 85.66 million shares had traded [1]. The 20-day average for a full session is 36.96 million [3]. So the stock had already done about 2.3 times a normal entire day's volume in under a third of a day. An independent vendor put the figure at 86.87 million against a three-month average of 41.48 million [2]. That establishes unusually high participation. It does not establish who was buying: index and derivative-hedging flow, discretionary accumulation and short covering all clear through the same order book and are indistinguishable on a single session's tape.
Short interest going in was 77.88 million shares — 3.70% of float, with a 1.73-day short ratio the vendor computes against an average volume higher than the 20-day figure quoted above [3]. As a fraction of float that is modest. In shares it is close to a full morning's volume, so covering could plausibly be a meaningful part of the print without being its cause. The available data do not permit the attribution either way.
Valuation scenarios
Probabilities are the author's illustrative estimates, not forecasts, and they sum to 100%. Each price is anchored to a published, dated figure rather than to a model, and the basis is stated so that target-anchored and observation-anchored scenarios are distinguishable.
| Scenario | Price | Probability | Valuation basis | Key drivers |
|---|---|---|---|---|
| Bull | ~$245 | 25% | Citi's Aug 4 target [8] | U.S. commercial growth holds near triple digits into 2027, international commercial re-accelerates from the 26% disclosed this quarter, and closed contract value catches up to revenue growth |
| Base | ~$187 | 50% | Consensus average, 35 analysts, Aug 4 [9] | FY2026 guidance of $8.15bn is met, growth decelerates as comparisons stiffen through 2027, and the multiple compresses roughly in line with earnings growth |
| Bear | ~$106 | 25% | The 52-week low of $106.37 [1] | Enterprise AI budgets digest, international commercial stays near flat sequentially, and the multiple returns to the ~31× guided revenue the market assigned within the past year |
| Blended | ~$181 | 100% | Author's weights | About 13% above the $159.66 intraday price |
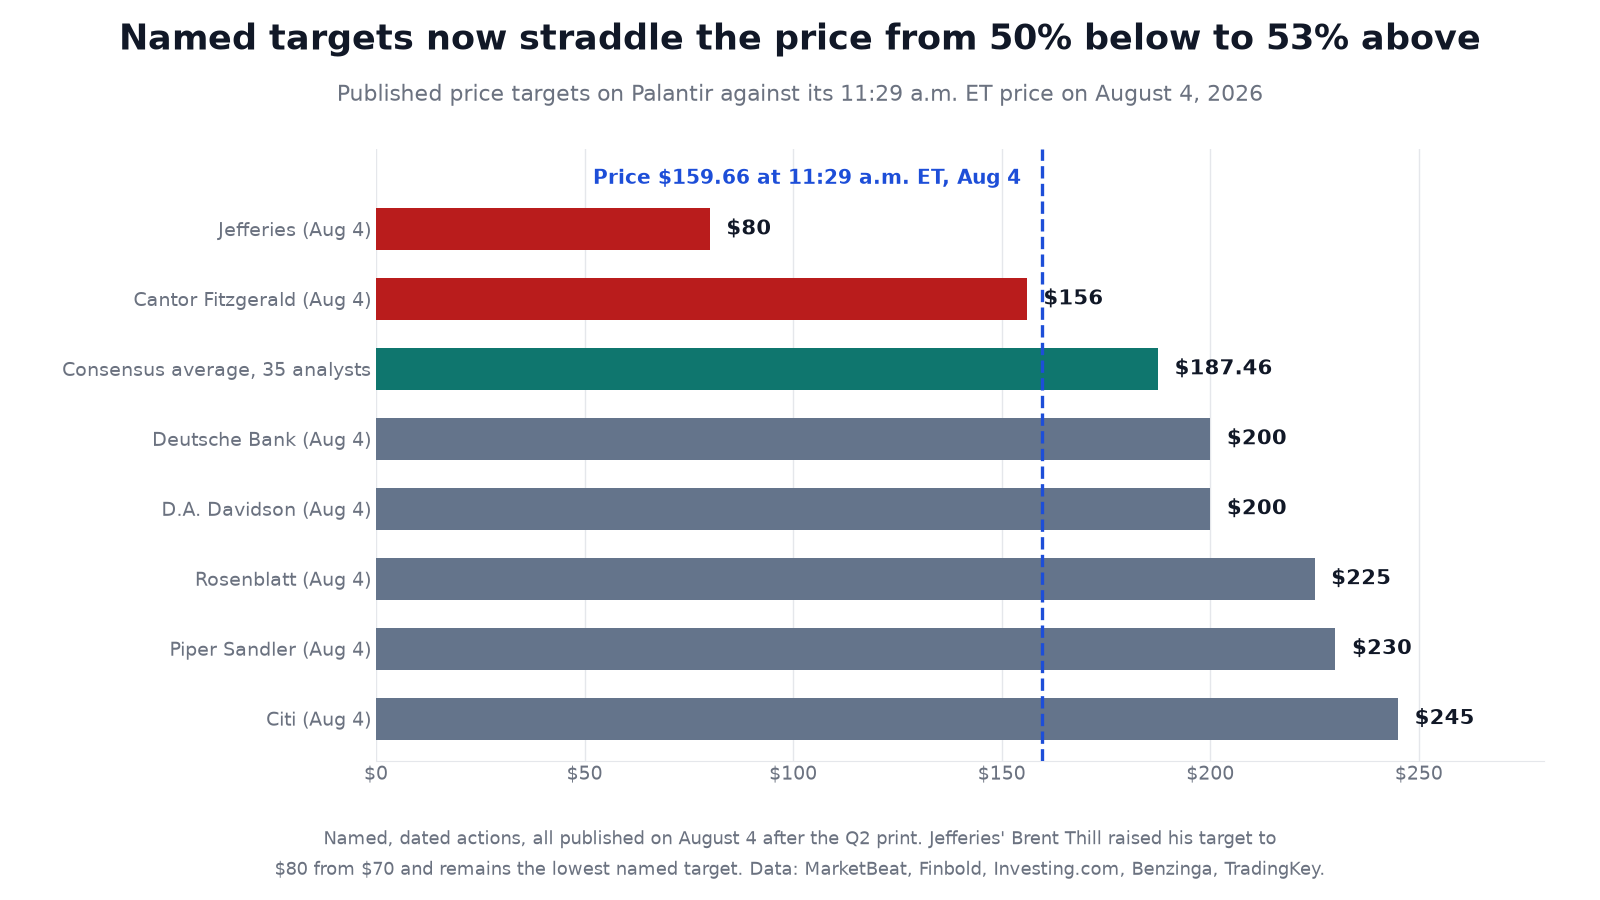
Three caveats belong with that table. The bear anchor is a price this stock actually traded at within the past 52 weeks, not a modelled downside — and at $106.37 the market capitalisation would still be roughly $255 billion, about 31 times guided current-year revenue, so it is a de-rating rather than a re-rating to anything resembling a normal software multiple. The base anchor is a sell-side average that mostly predates the print. And aggregator panels currently show a low target of $80 against a high of $255, a range far wider than the scenarios above, which is itself the finding: the disagreement about this company is about the durability of growth, not about this quarter [9].
Why it matters
Enterprise software has spent two years arguing about whether AI demand converts into revenue at the application layer or is captured by the infrastructure beneath it. Most of the visible money so far has gone to the infrastructure side — the memory, networking and data-center names this site has covered through Micron, CoreWeave and Dell. A 149% U.S. commercial growth rate on a $764 million quarterly base, at a 62% adjusted operating margin, is a substantial listed datapoint that an application-layer vendor can capture it too [5]. Whether it is representative is not something one company's release can settle.
Whether that read-through was visible in the tape is not something this cross-section can settle either. Datadog and Snowflake did outpace Salesforce and ServiceNow at the same timestamp [16][17][18][19], but Datadog reports its own second quarter on August 6, so pre-earnings positioning is an equally available explanation [23]. The ordering is consistent with a read-through; it is not evidence of one. The limits are worth naming in any case: Palantir's growth is weighted to a U.S. government business that grew 90% and to a forward-deployed engineering model few competitors run [5].
The valuation is the other half of why it matters. At $159.66 the company carries a market capitalisation near $383 billion [1]. Against the midpoint of its own newly raised full-year guidance that is roughly 47 times current-year revenue, about 76 times guided adjusted operating income on an enterprise value near $373 billion, and about 83 times guided adjusted free cash flow — all author-derived from the guidance ranges and the intraday price rather than taken from a vendor field, which on a gap day of this size can still reflect the prior close [1][3][6]. Those multiples are not a verdict. They do mean the stock is priced on growth persisting well beyond the current guidance period, which is precisely the point Jefferies has been making since May [13].
What should investors watch after Palantir's Q2 2026 print?
Four things, in rough order of how much they would change the analysis.
Whether U.S. commercial growth holds its pace. The full-year guide of above $3.424 billion at 134%-plus growth is a floor, and a full-year rate is not directly comparable to a quarterly one. The cleaner test is the implied second half: first-half U.S. commercial revenue was about $1.36 billion, so the guide implies more than $2.06 billion in the second half, roughly 52% above the first [5][21]. Comparisons stiffen materially through 2027.
Whether international commercial revenue moves at all. Two percent sequential growth on a $182 million base is the softest disclosed line in the release, and it is the one Jefferies has built its bear case around [13][21].
Whether closed contract value catches up. Booked TCV growth of 49% against 93% revenue growth is a single lumpy reading, and total remaining deal value at +83% argues the pipeline is healthier than that one measure implies [5][21]. A second quarter of closed bookings lagging revenue would matter considerably more than one.
Whether the buy side follows the sell side. At least nine firms published within hours of the print, and six of them actually moved a target or a rating — Citi, UBS, Deutsche Bank, D.A. Davidson, Cantor Fitzgerald and Jefferies — while Piper Sandler and Rosenblatt reiterated existing ones [8][9][13]. MarketBeat's panel still carries 10 Holds and 3 Sells among 35 analysts [9]. Ratings migration over the coming weeks is a cleaner signal than the first day's target raises, which are largely mechanical.
Why did PLTR stock go up on August 4, 2026?
Palantir rose 27.07% to $159.66 as of 11:29 a.m. ET from Monday's $125.65 close after reporting second-quarter results that beat on every headline line and came with a raised full-year outlook [1][5]. Revenue of $1.935 billion grew 93% year over year against consensus near $1.80–$1.81 billion; adjusted earnings were $0.41 a share versus a $0.34–$0.35 consensus; U.S. commercial revenue grew 149% to $764 million; and full-year revenue guidance rose to $8.150–$8.158 billion, or 82% growth, from a prior guide implying about 71% [5][6][7][10]. Six firms moved a target or rating the same morning, including a Deutsche Bank upgrade to Buy and a Citi raise to $245 [8][11]. The broad market was also higher — the Nasdaq-100 proxy was up 2.55% — so part of the move was shared, but Palantir led it by roughly 24.5 percentage points [14].
The August 4 move in numbers
| Measure | Value | As of / source |
|---|---|---|
| Prior close, Mon Aug 3 | $125.65 (+2.10%) | Aug 3, 2026 settled close — StockAnalysis [4] |
| Price, Tue Aug 4 | $159.66 (+$34.01, +27.07%) | Aug 4, 2026, 11:29 a.m. ET — StockAnalysis [1] |
| Independent cross-check | $159.49 (+$33.84, +26.93%) | Aug 4, 2026, 11:29:38 a.m. ET — Investing.com [2] |
| Open / intraday range | $145.15 / $143.28 – $160.41 | Aug 4, 2026 session to 11:29 a.m. ET — StockAnalysis [1] |
| Volume vs. average | 85,663,259 by 11:29 a.m. ET vs. a 36.96M 20-day full-session average (~2.3× a whole normal day, ~30% of the session elapsed) | Aug 4, 2026 intraday — StockAnalysis [1][3] |
| 52-week range | $106.37 – $207.52 (price ~23% below the high, ~50% above the low) | Aug 4, 2026 — StockAnalysis [1] |
| Market capitalisation | ~$383bn on ~2.40bn shares; ~$81.5bn added versus the prior close | Aug 4, 2026, 11:29 a.m. ET — StockAnalysis [1][3] |
| Short interest | 77.88M shares (3.70% of float; 1.73 days to cover) | Latest settlement — StockAnalysis [3] |
| Consensus target | $187.46 average, 35 analysts, Moderate Buy (20 Buy, 10 Hold, 3 Sell, 2 Strong Buy); range $80–$255 | Accessed Aug 4, 2026 — MarketBeat [9] |
| Valuation on FY2026 guidance | ~47× revenue, ~76× adjusted operating income (on ~$373bn EV), ~83× adjusted free cash flow | Author-derived from the Aug 3 guidance and the 11:29 a.m. price [1][6] |
How did Palantir compare with its software peers and the market?
| Name | Intraday change | Gap vs. PLTR |
|---|---|---|
| Palantir (PLTR) | +27.07% | — |
| Datadog (DDOG) | +3.87% | −23.2 pts |
| iShares Expanded Tech-Software ETF (IGV) | +3.79% (≈+1.8% excluding Palantir) | −23.3 pts (≈−25.3 ex-PLTR) |
| Snowflake (SNOW) | +2.89% | −24.2 pts |
| Invesco QQQ Trust (QQQ) | +2.55% | −24.5 pts |
| Salesforce (CRM) | +1.76% | −25.3 pts |
| ServiceNow (NOW) | +1.02% | −26.1 pts |
All readings were taken between 11:27 and 11:30 a.m. ET on August 4 from one vendor [14][15][16][17][18][19]. Every name was higher, which is why the peer set is presented as a gap in percentage points rather than as evidence that the move was purely company-specific. The ex-Palantir IGV figure removes the stock's own 7.83% weight in that index and is approximate, since the weight itself is measured after the move [22]. These are intraday figures and will not match the settled closes.
Frequently asked questions
Why did Palantir (PLTR) stock go up on August 4, 2026?
Palantir traded up 27.07% at $159.66 as of 11:29 a.m. ET, from Monday's $125.65 close, after reporting second-quarter results after the close on August 3 that beat on every headline line. Revenue of $1.935 billion grew 93% year over year against consensus near $1.80–$1.81 billion, adjusted earnings were $0.41 a share versus a $0.34–$0.35 consensus, U.S. commercial revenue grew 149% to $764 million, and adjusted free cash flow was $1.220 billion. The company also raised full-year 2026 revenue guidance to $8.150–$8.158 billion, or 82% growth, from a prior guide implying about 71%. Six firms moved a target or rating the same morning and two more reiterated. The broader market was also strong — the Invesco QQQ Trust was up 2.55% at the same timestamp — so part of the move was shared, but Palantir led the software group by roughly 24.5 percentage points.
What were Palantir's Q2 2026 results in full?
Total revenue was $1.935 billion, up 93% year over year and 19% sequentially. U.S. revenue was $1.573 billion, up 115%, split between U.S. commercial at $764 million (up 149% and 28% sequentially) and U.S. government at $809 million (up 90%). International commercial revenue was $182 million, up 26% and 2% sequentially, and international government revenue $181 million, up 42% and 5%. Adjusted operating income was $1.194 billion, a 62% margin; GAAP operating income was $912 million, a 47% margin; GAAP net income was $1.062 billion; adjusted gross margin was 86%. Adjusted free cash flow was $1.220 billion, 63% of revenue. Total contract value booked was $3.373 billion, up 49%; total remaining deal value was $13.1 billion, up 83% year over year and 11% sequentially; U.S. commercial remaining deal value was $6.238 billion, up 124% and 27% sequentially. Cash, equivalents and short-term Treasuries stood at $9.2 billion, and the Rule of 40 score was 155.
What is Palantir's guidance for the rest of 2026?
Full-year 2026 revenue guidance was raised to $8.150–$8.158 billion, representing 82% growth, up from a prior guide implying roughly 71% and about $7.65–$7.66 billion. U.S. commercial revenue is now guided to exceed $3.424 billion, at least 134% growth. That is a full-year rate and is not directly comparable to the 149% just delivered in a single quarter; the cleaner read is the implied second half, since first-half U.S. commercial revenue was about $1.36 billion, so the guide implies more than $2.06 billion in the second half — roughly 52% above the first, and a floor rather than a midpoint. Adjusted operating income is guided to $4.889–$4.897 billion and adjusted free cash flow to $4.5–$4.7 billion. For the third quarter, revenue is guided to $2.160–$2.164 billion, about 12% above the second quarter sequentially, with adjusted operating income of $1.292–$1.296 billion.
Is Palantir stock expensive after the August 4 move?
On the numbers the multiple is high by any software standard. At $159.66 the market capitalisation was near $383 billion, which is roughly 47 times the midpoint of the company's own newly raised full-year revenue guidance, about 76 times guided adjusted operating income on an enterprise value near $373 billion, and about 83 times guided adjusted free cash flow. Those are author-derived from the guidance ranges and the intraday price rather than taken from a vendor field, which on a gap day of this size can still reflect the prior close. What the multiple means is a separate question from what it is: it requires growth to persist well beyond the current guidance period. Even the bear scenario used in this article — a return to the 52-week low of $106.37 — would leave the company at roughly 31 times guided current-year revenue. Jefferies' Brent Thill, who raised his target only to $80 from $70 after the print, has argued since May that the valuation already embeds aggressive assumptions about growth durability, and Cantor Fitzgerald's Thomas Blakey raised his target to $156 the same morning while staying at Neutral — a target below the price as of this writing.
What did analysts do after Palantir's Q2 2026 earnings?
At least nine firms published within hours of the print, and six of them actually moved a target or a rating. Deutsche Bank's Brad Zelnick upgraded from Hold to Buy while leaving his $200 target unchanged. Citi's Tyler Radke raised to $245 from $200, UBS to $220 from $200, and D.A. Davidson's Gil Luria to $200 from $175. Cantor Fitzgerald's Thomas Blakey raised to $156 from $138 but stayed at Neutral, and Jefferies' Brent Thill raised to $80 from $70, the lowest named target on the stock. Piper Sandler's Clarke Jeffries reiterated Overweight at $230 and Rosenblatt reiterated Buy at $225 — reiterations, not moves. MarketBeat's panel showed a Moderate Buy consensus across 35 analysts at an average target of $187.46, with a range of $80 to $255 and a breakdown of 2 Strong Buy, 20 Buy, 10 Hold and 3 Sell; StockAnalysis showed a $187.16 average the same day on a different contributor set.
Was the August 4 gain specific to Palantir or a sector move?
Predominantly company-specific, but not entirely. Every software name in the comparison group was higher at the same 11:27–11:30 a.m. ET timestamp: Datadog +3.87%, the iShares Expanded Tech-Software ETF +3.79%, Snowflake +2.89%, Salesforce +1.76% and ServiceNow +1.02%, with the Invesco QQQ Trust +2.55%. Palantir led the Nasdaq-100 proxy by roughly 24.5 percentage points. The software ETF comparison needs an adjustment, because Palantir is itself 7.83% of that index: its own advance contributed about 2.1 points of the ETF's 3.79%, implying the rest of the index rose roughly 1.8% and putting the company-specific gap nearer 25 percentage points. Only Palantir reported that morning. That cross-section supports the reading that a low-single-digit portion of the advance reflected shared conditions and the remainder was specific to the print, but it does not support a precise decomposition and none is offered.
What was weak in Palantir's Q2 2026 report?
Two disclosed lines ran well below the 93% headline. The first is international commercial revenue, at $182 million, up 26% year over year and just 2% sequentially — against 28% sequential growth in U.S. commercial. That is the segment meant to show the platform sells outside its home market, and it barely moved quarter on quarter; it is also the line Jefferies has built its bear case around. The second is closed bookings: total contract value booked grew 49%, some 44 percentage points below the revenue growth rate. That one needs context rather than alarm, because the backlog measures tell a different story — total remaining deal value rose 83% year over year and 11% sequentially, and U.S. commercial remaining deal value 124% and 27% sequentially, the latter almost exactly matching the 28% sequential rise in U.S. commercial revenue. Closed contract value is the lumpiest of the three measures, so a single reading establishes little; a second quarter of it lagging revenue would matter considerably more.
How unusual was Palantir's trading volume on August 4?
Extraordinary, with the caveat that the session was still open. By 11:29 a.m. ET — roughly 119 of the session's 390 minutes, about 30% elapsed — 85.66 million shares had traded against a 20-day average of 36.96 million for a full session. In other words the stock had already done about 2.3 times a normal entire day's volume in under a third of a day. An independent vendor put the figure at 86.87 million against a three-month average of 41.48 million. That establishes unusually high participation, not the identity of the buyers: index and derivative-hedging flow, discretionary accumulation and short covering all clear through the same order book and cannot be separated on a single session's tape. Short interest going in was 77.88 million shares, 3.70% of float — modest as a fraction of float, but close to a full morning's volume in share terms, so covering could plausibly be a meaningful part of the print without being its cause. The available data do not permit the attribution either way.