Stock Analysis
Why did CoreWeave (CRWV) stock jump on August 3, 2026? A neocloud rally, and a loan that priced wider
CoreWeave closed up 19.23% at $85.57 in a market-wide risk-on session, outpacing the Nasdaq-100 proxy by 17.5 points. In the same week its $2.6 billion term loan cleared 100–125 basis points wider than marketed, at a three-point discount to par.

Summary
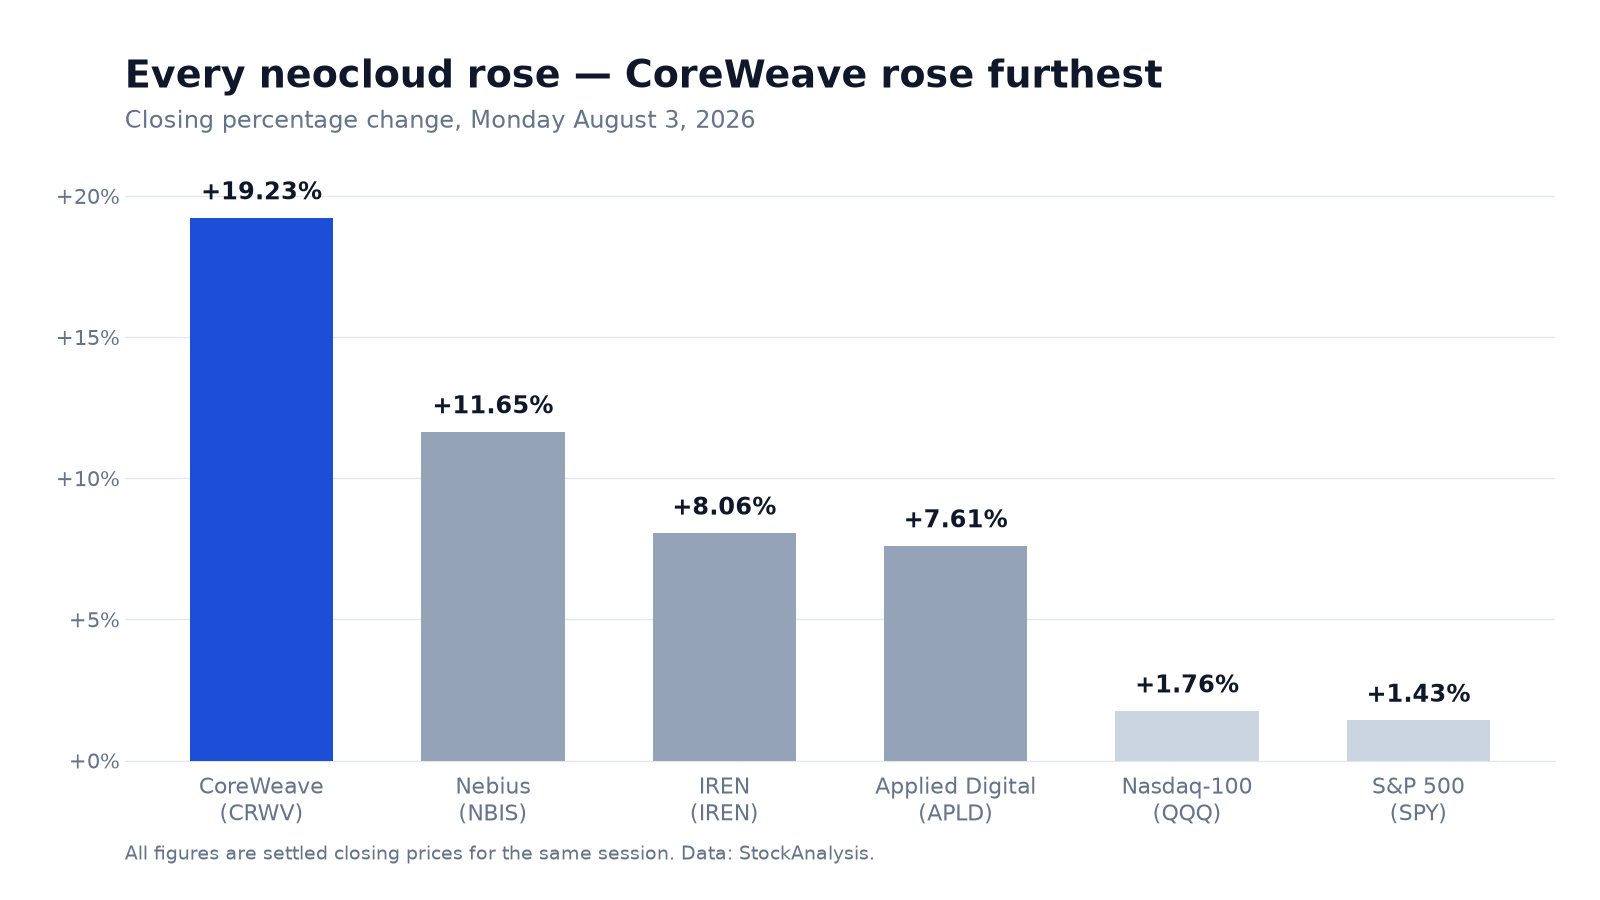
CoreWeave, Inc. (NASDAQ: CRWV) closed Monday, August 3, 2026 at $85.57, up $13.80 or 19.23% from Friday's $71.77 close, on 34,367,115 shares [1][2]. The session's trigger was macro rather than corporate: President Trump called off planned strikes on Iran and signalled that talks would resume, crude fell roughly 6%, and risk assets rallied broadly [3][4]. But the Invesco QQQ Trust rose 1.76% and the SPDR S&P 500 ETF 1.43% [5][6]. CoreWeave outpaced the Nasdaq-100 proxy by 17.5 percentage points. The market move explains the direction; it does not account for the magnitude, and the magnitude is not fully observable from the tape.
Three stock-specific conditions sat underneath it. CoreWeave is the highest-beta listed expression of the AI-infrastructure trade, and its neocloud comparators moved with it — Nebius (NBIS) closed +11.65%, IREN +8.06%, Applied Digital (APLD) +7.61% [7][8][9] — after Amazon crossed a $3 trillion market capitalisation on June-quarter results in which AWS revenue grew 37% year over year to $42.2 billion [10]. Short interest stands at 64.36 million shares, 20.46% of the float [11]. And the company had just completed a $2.6 billion term loan, eight days ahead of Q2 results.
That loan is the part of the week worth the most attention, because its terms moved the other way. CoreWeave raised the money — at a spread 100 to 125 basis points wider than it marketed, at a discount to par, and with maintenance covenants attached [12]. The two markets are pricing different claims on the same balance sheet, and both moves can be internally rational. They imply different things about how much risk is left in the equity.
What actually drove CoreWeave's August 3 move?
The shape of the session is unusual. CoreWeave opened lower, at $70.56 against the $71.77 prior close — a 1.7% downward gap — and traded to a low of $69.89, beneath Friday's $69.97 low, before reversing to a high of $85.88 and closing within $0.31 of it [2]. A 19% advance that begins by making a new short-term low did not come from an overnight disclosure. The move was built during the session rather than gapping at the open, which is consistent with — though it does not establish — flow-driven rather than news-driven buying.
The macro catalyst is documented. Halting the Iran strikes sent Brent crude down about 6% to roughly $83 and WTI down nearly 7% to $78.93, unwinding the prior week's energy risk premium [3][4]. Layered on it was sector validation from hyperscaler results: the June quarter's cloud numbers, and Amazon's $3 trillion milestone, confirmed that capital expenditure by CoreWeave's largest customers is still rising [10]. That reading cuts both ways, and the article should say so plainly — the same capex that funds GPU rental is what allows those buyers to build in-house, which is precisely the published bear case on this stock.
Volume qualifies the picture rather than settling it. CoreWeave traded 34,367,115 shares against a 20-day average of 25,780,746 — about 1.33 times normal, and below the 43,515,338 shares that changed hands on July 30, when the stock rose 21.51% on the Leidos announcement [2][11]. Neither the price nor the volume identifies who was buying. Short covering and fresh accumulation are indistinguishable in a single session's tape; both are purchases that clear against the same order book. The short base is large — 20.46% of the float, equivalent to about 2.5 days of average volume, though days-to-cover assumes shorts are the entirety of trading, which they never are — but it is reported as of the most recent settlement date and does not capture covering that may already have occurred during July 30's 21.51% advance [11].
One datable institutional purchase does sit just before the move: ARK Invest bought 298,243 CoreWeave shares on July 31 — 208,228 in ARKK and 90,015 in ARKW, roughly $22 million — disclosed on August 1 [13]. It is not an August 3 catalyst, and it is small against the day's turnover, but it is a dated, disclosed buy in the session immediately before. Running the other way, chief executive Michael Intrator sold roughly 981,000 shares for about $79.8 million across three July tranches — 369,489 shares on July 7–8, 307,692 on July 14 and about 303,692 on July 21 — all under a Rule 10b5-1 plan adopted on November 20, 2025, which makes them scheduled rather than discretionary [14][15][16].
Why did CoreWeave's new $2.6 billion loan price 100bp wider?
CoreWeave completed a $2.6 billion first-lien delayed-draw term loan due September 1, 2031, through a JPMorgan-led arranger group. It was marketed at SOFR plus 425 to 450 basis points with an original issue discount of 99. Demand at that level was insufficient, and it cleared at SOFR plus 550 with an OID of 97 and a 0% floor — a yield to maturity of 10.44% [12]. Lenders also required maintenance covenants: a 1.35× debt-service coverage ratio at the borrower level, alignment with the financial covenants under the parent's revolving facility until the parent reaches investment grade, and a $112.5 million liquidity requirement [12].
The clean observation here is within the deal, and it needs no cross-deal comparison to hold: the same loan, to the same borrower, in the same month, moved 100–125 basis points wider and three points below par between launch and close. On $2.6 billion, the spread widening alone is roughly $26 million to $32.5 million of additional annual interest when fully drawn — set against guided second-quarter interest expense of $650 million to $730 million, which annualises to roughly $2.6–2.9 billion, so the increment is on the order of 1% [17]. The three-point discount is a separate, one-time cost of about $78 million on the full amount.
Cross-deal comparisons need more care than a headline allows, and one cuts firmly against reading this as a blanket re-rating of CoreWeave's credit. In May the company priced a $3.1 billion facility at SOFR plus 450 [12]. But on March 30 it closed an $8.5 billion delayed-draw facility rated A3 by Moody's and A (low) by DBRS — the first investment-grade-rated financing secured by high-performance-computing infrastructure and its associated customer contract — at SOFR plus 2.25% floating and roughly 5.9% fixed [18]. Different structures, collateral packages, borrowing entities, maturities and ratings; the spreads are not strictly comparable. It is also worth stating explicitly that this $2.6 billion facility is distinct from the similarly sized $2.6 billion secured facility CoreWeave closed in July 2025 [19]. What the August deal is, without overreach, is a concrete data point that AI-infrastructure lenders are pricing and structuring these loans differently than they did earlier in the year. Whether it marks a trend or a single wide print will not be clear until the next facility prices.
Valuation scenarios
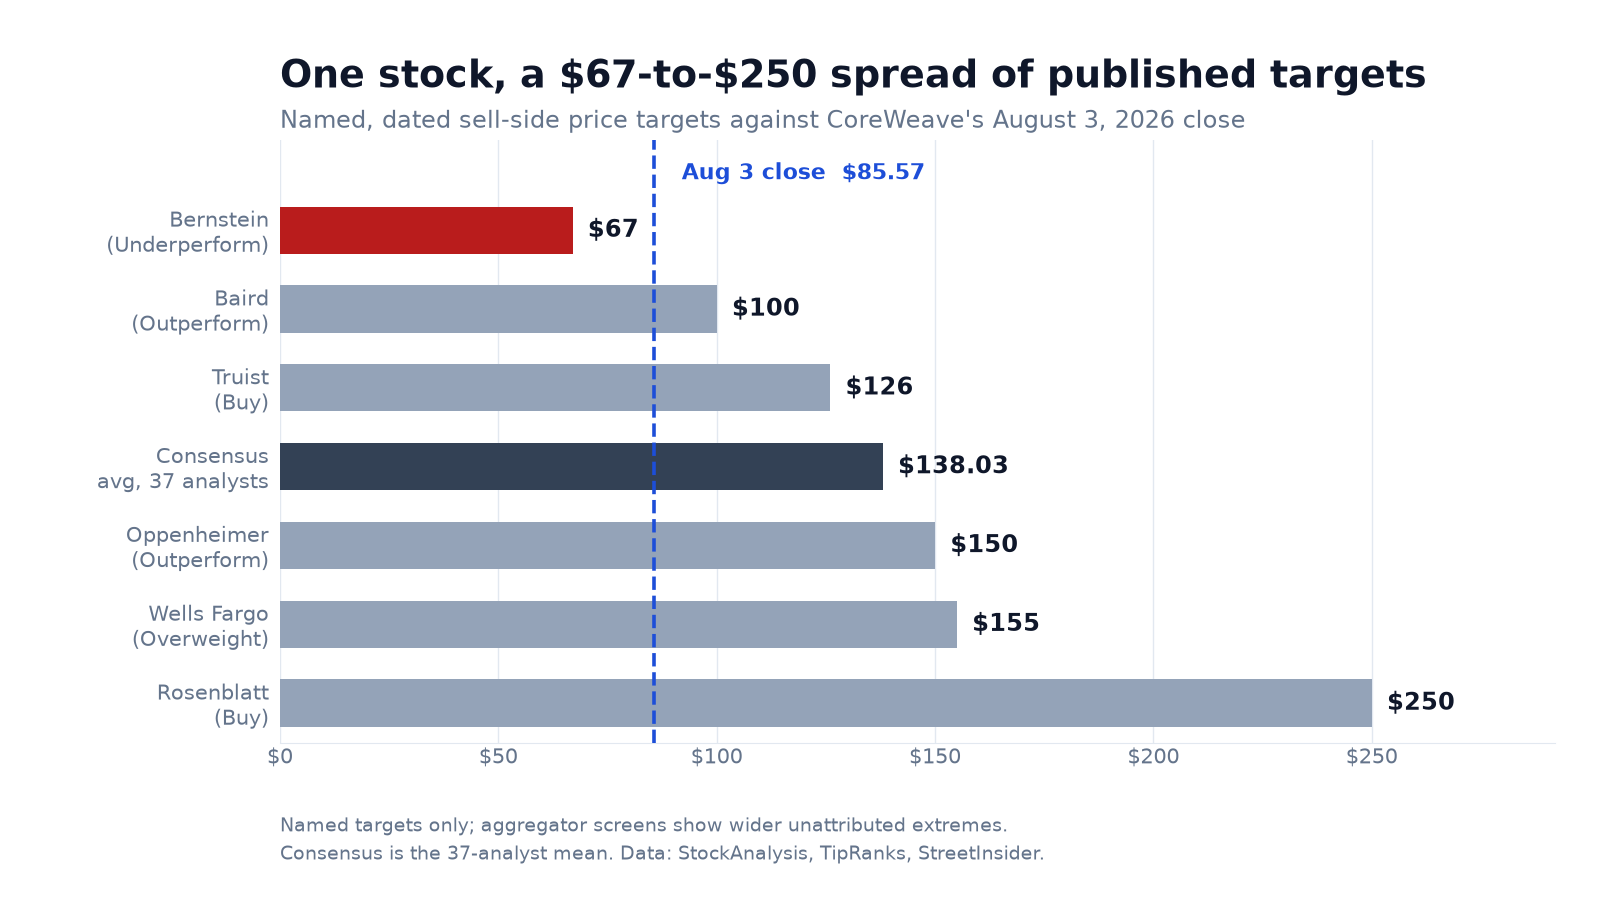
Probabilities are the author's illustrative estimates, not forecasts, and they sum to 100%. The bull, base and bear prices are each anchored to a published, dated analyst target rather than to a model.
| Scenario | Price | Probability | Key drivers |
|---|---|---|---|
| Bull | ~$155 | 25% | Wells Fargo's Overweight target (May 8) holds: Q2 revenue beats the ~$2.56bn consensus, the $99.4bn backlog converts on schedule, and the Leidos federal channel produces bookings [25][26] |
| Base | ~$126 | 40% | Truist's target on its July 22 upgrade (Ramnani): revenue trajectory intact, but rising interest expense and continued share issuance cap the multiple [27] |
| Bear | ~$67 | 35% | Bernstein's Underperform case: hyperscalers build and resell capacity themselves over time, compressing pricing power — with the Meta relationship, ~35% of backlog, the central exposure [21][22] |
| Blended | ~$112.60 | 100% | About 32% above the $85.57 close — but see the downside haircut in the Analyst view |
Why it matters
CoreWeave is the clearest public test of whether the AI buildout can be debt-financed at scale. Its revenue backlog reached $99.4 billion at the first quarter, up roughly 50% sequentially and close to four times year over year, and it is near-term weighted: about 36% is expected to be recognised within 24 months and 75% within four years [26]. That backlog is the asset the debt is written against, and it is concentrated. Meta accounts for roughly $35.2 billion of committed agreements running through 2032 — about 35% of the total — of which $21 billion was signed in March 2026 [22][24]. Evercore ISI has characterised those contracts as committed, long-term, take-or-pay and non-cancellable [24]. Concentration has been the market's recurring worry regardless: the stock fell 13.9% on July 2 on reports Meta was building a commercial cloud, and fell sharply again when Meta Compute was formally announced on July 17 [24][23]. For scale on where this started, two customers accounted for 77% of revenue in 2024, Microsoft alone 62% [28]; by the first quarter of 2026 commitments from non-investment-grade AI-native companies and foundation labs represented less than 30% of backlog [26].
This is why July 30's Leidos partnership moved the stock 21.51% on the heaviest volume of the period: Leidos leads mission integration and accreditation while CoreWeave supplies its AI-native platform inside facilities accredited for classified work, opening a federal and intelligence channel whose counterparty risk is unrelated to the hyperscalers [29]. Diversification of the customer base, not incremental capacity, is what changes this equity's risk profile. The same logic has driven moves we have covered in adjacent names — TeraWulf and Hut 8 each rose on signing a data-center lease, while Dell fell when the market rotated out of AI hardware exposure.
What should investors watch before CoreWeave's Q2 earnings?
The next real information arrives on Tuesday, August 11, 2026, when CoreWeave reports second-quarter results, with consensus revenue near $2.56 billion against $1.21 billion a year earlier [25]. Three items carry more weight than the top line. First, interest expense against the guided $650–730 million range: the August facility's terms make the upper half of that range the one to watch, and an upward revision to the forward guide would matter more than the quarter itself [17]. Second, the 2026 adjusted operating income target of $900 million to $1.1 billion, which is the specific figure the bear case disputes [21]. Third, backlog composition — whether the Meta commitments are reaffirmed, and whether the federal channel has converted into bookings.
Beyond the print, the financing calendar is now its own indicator. CoreWeave finances GPU purchases with debt and reported a $1.59 billion net loss on $6.23 billion of trailing revenue [20]; the price and structure of its next facility will say more about the market's view than any single session's tape. The stock closed 44% below its 52-week high of $153.20 and about 41% above the $60.55 low set three sessions earlier, on July 29 [2].
Why did CRWV stock go up on August 3, 2026?
CoreWeave rose 19.23% to $85.57 from a $71.77 prior close in a broad risk-on session after President Trump called off planned strikes on Iran, sending crude down about 6% [1][3]. The rally was sector-wide rather than company-specific: every neocloud comparator gained, with Nebius up 11.65%, IREN 8.06% and Applied Digital 7.61%, against 1.76% for the Nasdaq-100 proxy [5][7][8][9]. CoreWeave, the highest-beta name in the group, moved furthest. Volume was 1.33 times its 20-day average and below July 30's level, and no company announcement was dated to the session; the completion of a $2.6 billion term loan and positioning ahead of August 11 earnings are context rather than a confirmed cause [2][12].
The August 3 move in numbers
| Measure | Value | As of / source |
|---|---|---|
| Prior close, Fri Jul 31 | $71.77 (−2.88%) | Jul 31, 2026 close — StockAnalysis [2] |
| Close, Mon Aug 3 | $85.57 (+$13.80, +19.23%) | Aug 3, 2026, 4:00 p.m. ET — StockAnalysis [1][2] |
| Open / day's range | $70.56 / $69.89 – $85.88 | Aug 3, 2026 session — StockAnalysis [2] |
| Volume vs. average | 34,367,115 vs. 25,780,746 20-day average (~1.33×) | Aug 3, 2026 settled — StockAnalysis [2][11] |
| 52-week range | $60.55 – $153.20 | Aug 3, 2026 — StockAnalysis [1] |
| Market capitalisation | ~$46.7 billion | Aug 3, 2026 — StockAnalysis, on its 545.57M share count [1] |
| Shares outstanding / float | 545.57M / 314.53M (float 57.7% of shares out) | Aug 3, 2026 — StockAnalysis [11] |
| Short interest | 64.36M shares (20.46% of float; 11.80% of shares out; ~2.5 days at the 20-day average) | Latest settlement — StockAnalysis [11] |
| Consensus target | $138.03 average / $137.50 median, 37 analysts, Buy | Accessed Aug 3, 2026 — StockAnalysis [20] |
| Revenue (ttm) / net income | $6.23B (+129.9%) / −$1.59B | Latest reported — StockAnalysis [20] |
| Revenue backlog | $99.4B (36% within 24 months, 75% within 4 years) | Q1 2026 — company results [26] |
How did CoreWeave compare with its peers and the market?
| Name | Close, Aug 3 | Change | Prior close |
|---|---|---|---|
| CoreWeave (CRWV) | $85.57 | +19.23% | $71.77 |
| Nebius Group (NBIS) | $212.60 | +11.65% | $190.41 |
| IREN Limited (IREN) | $39.77 | +8.06% | $36.80 |
| Applied Digital (APLD) | $29.48 | +7.61% | $27.39 |
| Invesco QQQ Trust (QQQ) | $700.08 | +1.76% | $687.99 |
| SPDR S&P 500 ETF (SPY) | $757.69 | +1.43% | $747.03 |
All figures are settled closing prices for the same session, taken from one vendor [5][6][7][8][9]. The group moved together, which is the main finding: this was an AI-infrastructure move, not a CoreWeave event. CoreWeave's additional 7.6 percentage points over Nebius is consistent with its higher beta and larger short base, but those are conditions rather than a measured decomposition of the move.
Frequently asked questions
Why did CoreWeave (CRWV) stock go up on August 3, 2026?
CoreWeave closed up 19.23% at $85.57 from a $71.77 prior close in a broad risk-on session, after President Trump called off planned strikes on Iran and signalled talks would resume, sending Brent crude down about 6%. The move was sector-wide rather than company-specific: Nebius closed up 11.65%, IREN 8.06% and Applied Digital 7.61%, against 1.76% for the Invesco QQQ Trust. CoreWeave, the highest-beta name in the group, moved furthest, outpacing the Nasdaq-100 proxy by 17.5 percentage points. Volume was 34.4 million shares, about 1.33 times the 20-day average but below July 30's 43.5 million. No company announcement was dated to the session; the completion of a $2.6 billion term loan and positioning ahead of August 11 earnings are context rather than a confirmed cause.
When does CoreWeave report Q2 2026 earnings, and what is expected?
CoreWeave reports second-quarter 2026 results on Tuesday, August 11, 2026. Consensus revenue is approximately $2.56 billion against $1.21 billion a year earlier, and the company is not profitable — full-year 2026 consensus is $12.63 billion of revenue and an EPS loss of $3.94. Three disclosures matter more than the top line: interest expense against the guided $650–730 million range, since the August facility's terms point toward the upper half; any update to the 2026 adjusted operating income target of $900 million to $1.1 billion, which is the specific figure the bear case disputes; and backlog composition, particularly whether the Meta commitments are reaffirmed and whether the federal channel has converted into bookings.
What are the terms of CoreWeave's new $2.6 billion debt facility?
It is a first-lien delayed-draw term loan due September 1, 2031, arranged by a JPMorgan-led group. It was marketed at SOFR plus 425 to 450 basis points with an original issue discount of 99, but demand at that level was insufficient and it cleared at SOFR plus 550 with an OID of 97 and a 0% floor — a yield to maturity of 10.44%. Lenders also required maintenance covenants: a 1.35× debt-service coverage ratio at the borrower level, alignment with the parent revolving facility's financial covenants until the parent reaches investment grade, and a $112.5 million liquidity requirement. The spread widening alone adds roughly $26–32.5 million of annual interest when fully drawn, about 1% of an annualised run-rate on guided quarterly interest expense, and the three-point discount is a separate one-time cost of about $78 million on the full amount. It is distinct from the similarly sized $2.6 billion facility CoreWeave closed in July 2025.
How much of CoreWeave's stock is sold short?
Short interest was 64.36 million shares at the most recent settlement — 20.46% of the 314.53 million-share float and 11.80% of the 545.57 million shares outstanding. Measured against the 20-day average volume of 25.78 million shares that is about 2.5 days to cover, while StockAnalysis publishes 2.20 days on its own methodology. Two cautions apply. Days-to-cover assumes short sellers are the entirety of trading volume, which never happens. And short interest is a settlement-date snapshot, so it does not capture any covering that occurred during July 30's 21.51% advance. A large short base is a condition that can amplify moves in both directions; it is not evidence that any particular session was a squeeze, and short covering is itself buying.
How much of CoreWeave's $99.4 billion backlog comes from Meta?
Meta accounts for roughly $35.2 billion of committed infrastructure agreements running through the end of 2032 — about 35% of the $99.4 billion revenue backlog reported for the first quarter of 2026 — of which $21 billion was signed in March 2026. Evercore ISI has characterised those contracts as committed, long-term, take-or-pay and not cancellable, and Rosenblatt argues Meta's contract bars it from reselling or subleasing the capacity. The concentration has nonetheless been the market's recurring worry: the stock fell 13.9% on July 2 on reports Meta was developing its own cloud business, and fell sharply again when Meta Compute was announced on July 17. The backlog overall is near-term weighted, with about 36% expected to be recognised within 24 months and 75% within four years.
Was CoreWeave's August 3 gain a company-specific event or a sector move?
Predominantly a sector move. Every neocloud comparator rose, and all rose far more than the broad market: Nebius +11.65%, IREN +8.06% and Applied Digital +7.61%, against +1.76% for QQQ and +1.43% for SPY. CoreWeave's additional 7.6 percentage points over Nebius is consistent with its higher beta and its larger short base, but that is a description of conditions rather than a measured decomposition of the move — a single session's price and volume cannot separate market beta from stock-specific flow. No CoreWeave announcement was dated to August 3 itself. The company-specific news of the period landed earlier: the Leidos federal partnership on July 30 and the completion of the $2.6 billion term loan.
Has there been notable insider or institutional activity in CRWV?
Both, in opposite directions. ARK Invest bought 298,243 shares in trades dated July 31, 2026 — 208,228 in ARKK and 90,015 in ARKW, roughly $22 million — disclosed on August 1, the session immediately before the move. Running the other way, chief executive Michael Intrator sold approximately 981,000 shares for about $79.8 million across three July tranches: 369,489 shares on July 7–8, 307,692 on July 14 and about 303,692 on July 21. All three were executed under a Rule 10b5-1 trading plan adopted on November 20, 2025, which makes them pre-scheduled rather than discretionary decisions taken on the July price action. Reported tranche sizes differ slightly between aggregators, so the total is stated as approximate.
What do analysts think CoreWeave stock is worth?
The consensus is a Buy with an average target of $138.03 and a median of $137.50 across 37 analysts, roughly 61% above the August 3 close. The dispersion matters more than the average. Among named, dated notes the range runs from Bernstein's $67 — Madison Rezaei's Underperform, a target she raised from $56 in April, on a structural view that hyperscalers will eventually build and resell capacity themselves — to Rosenblatt's $250, John McPeake's street-high initiated July 2 and reiterated after Meta Compute was announced. In between sit Baird at $100 (initiated July 22), Truist at $126 (upgraded to Buy July 22, target cut from $131 in the same note), Oppenheimer at $150 (April 29) and Wells Fargo at $155 (May 8). Vendor screens show wider unattributed extremes of $36 and $303, which are excluded here because neither could be tied to a dated note.