AI Infrastructure
CoreWeave (CRWV) Stock Jumps 18% After Q2 Margin Recovery, $104B Backlog
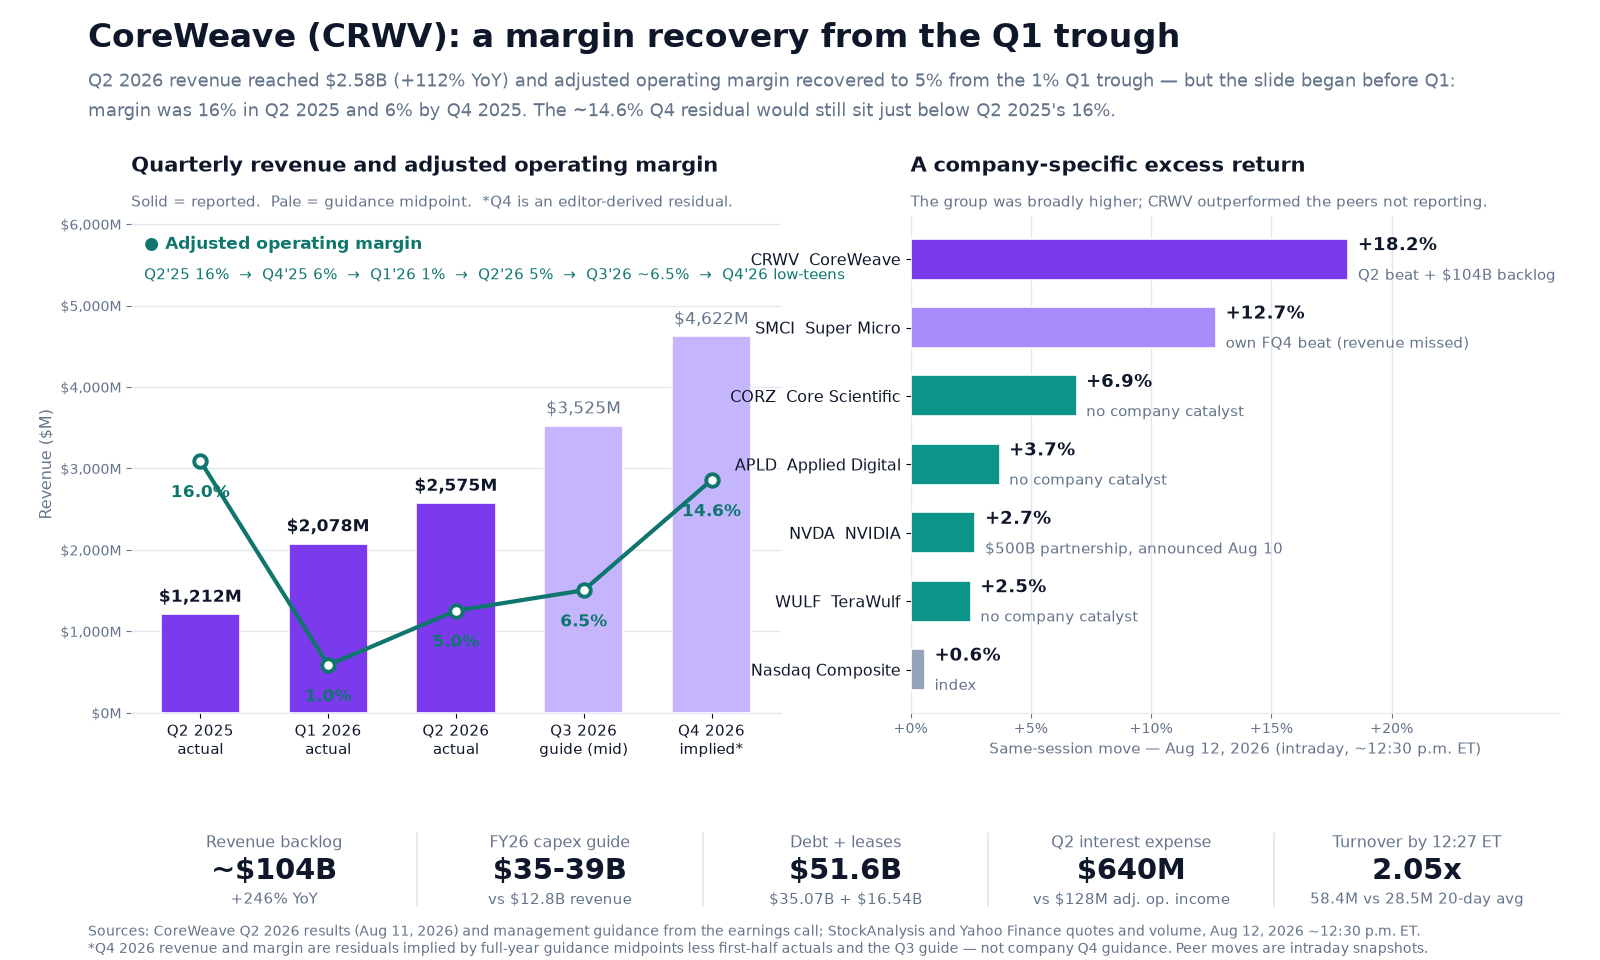
CoreWeave jumped about 18% to ~$107 after second-quarter revenue rose 112% to $2.58 billion with a $104 billion committed-contract backlog. The revenue beat was under 1%, so the weight fell on the margin trajectory: adjusted operating margin recovered to 5% from the 1% Q1 trough, though the slide began earlier — it ran 16% in Q2 2025 and 6% by Q4 2025. The counterweight is the balance sheet: $9.4B of capex in the quarter against $35-39B guided for 2026, $35.07B of debt plus $16.54B of leases, and $640M of quarterly interest against $128M of adjusted operating income.

Why CoreWeave stock jumped on August 12
On Wednesday, August 12, 2026, CoreWeave (NASDAQ: CRWV) jumped roughly 18% to about $107 from a $90.32 prior close, after reporting second-quarter results the previous evening [3][4]. Revenue was $2.575 billion, up 112% year over year, with a committed-contract backlog near $104 billion [1]. But the revenue beat was slim — about 0.6% above the ~$2.56 billion consensus — and is unlikely to explain the magnitude of the reaction on its own. The more consequential signal was the margin trajectory, alongside raised guidance, July pricing and backlog visibility [2]. Adjusted operating margin recovered to 5% from 1% in the first quarter, with low-teens guided for the fourth. That recovery needs context, though: the slide began well before Q1, with margin at 16% in Q2 2025 and 6% by Q4 2025 before bottoming at 1% [1][20].
What changed
CoreWeave rents AI compute — it buys NVIDIA systems and power at scale and sells capacity to the likes of OpenAI, Meta and Anthropic. A central bear case has been whether its unit economics justify the financing burden despite strong contracted demand. The second quarter spoke to that [1][2]:
- Revenue $2,575 million, up 112% year over year from $1,212 million and about 24% sequentially [1].
- Adjusted operating income $128 million (5% margin), up from $21 million (about 1%) in the first quarter — a sequential recovery from the Q1 trough. The full sequence is 16% in Q2 2025, 6% in Q4 2025, 1% in Q1 2026 and 5% now, so the deterioration predates the trough quarter [1][20].
- Adjusted EBITDA $1,510 million, roughly double a year ago in dollars, but at a 59% margin versus 62% a year earlier [1].
- Committed-contract backlog approximately $104 billion at June 30, up 246% year over year, excluding more than $25 billion of net new commitments signed early in Q3. It is subject to delivery and availability-of-service requirements — not recognized revenue or guaranteed cash — but management put a conversion benchmark on it: more than 50% was attached to contracts where delivery had already commenced, rising above two-thirds by year-end [1][2].
- Full-year 2026 revenue guidance raised to $12.4–$13.2 billion from $12–$13 billion, with adjusted operating income of $960 million to $1.15 billion and a year-end active power target lifted above 1.85 gigawatts [2].
- On the bottom line, GAAP diluted EPS was $(1.14) and the adjusted net loss $567 million (versus $130 million a year earlier); CoreWeave publishes no adjusted-EPS metric, and the widely quoted $1.03 loss per share is Zacks/LSEG third-party math against their own $1.13–$1.20 consensus [1][12]. GAAP net loss widened to $626 million from $290 million on $640 million of quarterly interest [1].
Do the arithmetic on the guidance
The company guided a full year and a third quarter, but not a fourth. Back it out and the implied acceleration is steep. Full-year revenue at the $12.8 billion midpoint, less $4.653 billion of first-half revenue and the $3.525 billion third-quarter guide, leaves roughly $4.6 billion for the fourth quarter; the same subtraction on adjusted operating income — $1.055 billion less $21 million, $128 million and the $230 million third-quarter midpoint — leaves about $676 million, a ~14.6% margin [2]. That is a mechanical midpoint residual and an editor-derived figure, not company Q4 guidance; independent annual and quarterly ranges need not reconcile exactly, and management's own language was simply low teens [2]. Either way the shape holds: almost all the improvement is back-loaded, and a ~14.6% Q4 would still sit just below Q2 2025's 16% while comfortably exceeding Q4 2025's 6% [1][20]. Underwriting the attempt, CoreWeave raised prices roughly 25% across SKUs in July, says near-term capacity is effectively sold out, and reports contribution margins on newer contracts 5 to 10 points above recent quarters [2].
Why it matters
CoreWeave is an unusually direct test of whether AI-infrastructure returns can exceed their cost of capital: it pairs $104 billion of contracted demand with $640 million of quarterly interest and public margin disclosure — a combination hyperscalers, funding capacity out of other businesses' profits, never have to show. If adjusted operating margin reaches the low teens while capacity stays sold out, the read-through runs to the miners-turned-landlords we track at Riot Platforms and Hut 8. If it stalls while interest compounds, this is where it shows first — as we noted on August 3, CoreWeave's cost of credit has become the sector's shared variable.
How the peers and sector traded the same day
The honest read is mostly company-specific, but not isolated from the sector: AI-infrastructure stocks were broadly higher, and CoreWeave materially outperformed the peers that were not reporting. With the Nasdaq Composite up about 0.6% and the S&P 500 up about 0.3% after a cooler inflation print [13][14]:
| Name (ticker) | Aug 12 move | Own catalyst? |
|---|---|---|
| CRWV — CoreWeave | +18.2% | Yes — Q2 results, raised guidance, ~$104B backlog [1][3] |
| SMCI — Super Micro | +12.7% | Yes — its own fiscal Q4 2026 report (Aug 11): adjusted EPS $1.70 vs ~$0.96 expected and a strong FY2027 outlook, though revenue of $11.1B missed [18] |
| CORZ — Core Scientific | +6.9% | No — no confirmed company catalyst, 0.4x volume [13] |
| APLD — Applied Digital | +3.7% | No — no confirmed company catalyst, 0.5x volume [13] |
| NVDA — NVIDIA | +2.7% | Not same-day — its $500B AI-financing partnership was announced Aug 10; recent sector background [19] |
| WULF — TeraWulf | +2.5% | No — no confirmed company catalyst, 0.7x volume [13] |
| Nasdaq Composite (index) | +0.6% | CPI came in slightly cooler [14] |
What the Street did with it
The reaction was a broad target-raise with almost no rating changes [6][7][8][9][10][15]:
| Firm | Target | Rating | Core issue | Date & rationale |
|---|---|---|---|---|
| Rosenblatt (John McPeake) | $250 (maintained) | Buy | Demand vs supply | Aug 12 — the highest target among the firms shown here; cites the margin beat and demand exceeding supply [10] |
| Wells Fargo (Michael Turrin) | $155 → $160 | Overweight | Margin leverage | Aug 12 — 30–35% contribution margins and the improving margin trajectory [15][16] |
| Piper Sandler | $151 → $153 | Overweight | Power growth | Aug 12 — strong megawatt additions and broad-based AI demand [15] |
| Baird | $100 → $130 | Outperform | Power growth | Aug 12 — "solid quarterly results and encouraging deal and power metrics through August"; ~$400M ARR in non-GPU rental [6] |
| JPMorgan (Samik Chatterjee) | $110 → $120 | Neutral | Margin leverage | Aug 12 — margin improvement the primary driver. (JPMorgan had gone $105 → $110 on Aug 11, before the print) [8][15] |
| Mizuho | $100 → $115 | Neutral | Margin leverage | Aug 12 — raised on guidance and power, but wants "evidence of more margin leverage before changing its rating" [7] |
| DA Davidson | $100 (maintained) | Neutral | Capital returns | Aug 12 — the bear case: ~4% returns against a ~9% cost of capital, levered FCF near −$10.6B [9] |
| Bernstein | $67 → $74 | Underperform | Valuation | Aug 12 — raised the number, kept the rating, conceding "bulls are re-energized" [15][17] |
These eight are a selection, not the full set — other same-day actions included Cantor at $176, Truist at $155 and Northland at $165 [11]. But the spread among them, $74 to $250 inside 48 hours, is the point, and the core-issue column shows why: the bulls underwrite margin leverage and power growth, the bears underwrite capital returns. Across all 38 analysts tracked by StockAnalysis/S&P Global the range runs $36 to $303 [11]. Bernstein raising its target while keeping an Underperform rating captures the split precisely.
What to watch
- Q4 adjusted operating margin — third-quarter guidance implies only ~6.5%, so nearly all of the promised improvement lands in a quarter the company has not guided directly [2].
- Interest expense against operating income — Q3 guidance is $860–940 million of interest against $200–260 million of adjusted operating income. CoreWeave cut its weighted average cost of debt by nearly 300 basis points year over year [2]; DA Davidson argues the marginal cost has since moved the wrong way [9]. That disagreement over incremental returns versus funding cost is central to the valuation spread.
- Backlog conversion and power delivery — track against management's own benchmark: more than 50% of backlog attached to contracts already in delivery, rising above two-thirds by year-end. Contracted power reached 4.2 GW by the August 11 call, from ~3.7 GW at June 30 against 1.5 GW active; energization timing, not demand, is the constraint [1][2].
- Share count — the capex plan is funded partly with equity, and dilution reduces per-share value even if the enterprise compounds. Moves are tracked on the CRWV stock page and the earnings calendar.
Illustrative valuation scenarios
These are a descriptive, probability-weighted price-anchor exercise — not a forecast or a recommendation. They use a lease-inclusive enterprise value consistent with the StockAnalysis/S&P Global presentation (EV conventions vary between providers): market cap plus $35.07 billion of debt plus $16.54 billion of lease liabilities, less $5.52 billion of unrestricted cash — about $46.08 billion of net liabilities ahead of the equity, on roughly 545.6 million shares. That reconciles to the ~$104.3 billion enterprise value those providers report and puts the stock at 4.0x EV/2027 consensus revenue of ~$26.0 billion [1][5][11]. Two inputs are held fixed, and both are limitations: net liabilities stay at June 30 levels and the share count stays at 545.6 million, so the anchors do not price in the further debt or equity issuance the capex plan implies. Probabilities are the author's own illustrative estimates and sum to 100%.
| Scenario | Price anchor | Prob. | Key drivers |
|---|---|---|---|
| Bull | ~$178 (5.5x EV/2027 rev.) | 25% | Q4 margin reaches the low teens and keeps climbing past Q2 2025's 16%, the >$25B of new Q3 commitments converts, and the cost of debt keeps falling — the market re-rates on earnings power rather than capital intensity. Between Wells Fargo's $160 and Rosenblatt's $250 [10][15]. |
| Base | ~$118 (4.25x EV/2027 rev.) | 45% | Guidance is delivered and 2027 revenue roughly doubles, but capital intensity and interest expense hold the multiple close to today's 4.0x. Below the ~$143 consensus, near Mizuho's $115 and JPMorgan's $120 [7][11]. |
| Bear | ~$47 (2.75x EV/2027 rev.) | 30% | DA Davidson and Bernstein are right — returns stay below the cost of capital, financing tightens or reprices, and a large counterparty defers. Note the fixed-share-count assumption bites hardest here: heavy equity issuance would push the realised outcome lower still. Below the $60.55 52-week low and Bernstein's $74, above the $36 low of the analyst range [3][9][17]. |
Blending those (0.25 × $178 + 0.45 × $118 + 0.30 × $47) gives a probability-weighted anchor near $112 — within about 5% of the ~$107 price and roughly 21% below the $142.54 average [11]. The sensitivity matters more than the point estimate: with ~$46 billion of liabilities ahead of the equity, one turn of EV/2027 revenue is worth about $48 a share. That leverage cuts both ways, and it is why the same business supports a $74 target and a $250 target at once. This is descriptive analysis of a corporate event, not investment advice.
CRWV data snapshot — August 12, 2026 (timestamped)
| Figure | Value | As-of / source |
|---|---|---|
| Prior close | $90.32 | Tue, Aug 11, 2026 [3] |
| Primary intraday quote | $106.71 (+$16.39, +18.15%) | Aug 12, 12:27 p.m. ET — StockAnalysis [3] |
| Corroborating quote | $107.24 (+18.74%) | Aug 12, 12:12 p.m. ET — Yahoo Finance [4] |
| Intraday range | $105.44 – $111.83 | Aug 12 session, still open [3] |
| Turnover vs average | 58.4M shares by 12:27 p.m. ET vs a 28.5M 20-day full-session average — ≈2.05x | Aug 12, 12:27 p.m. ET — StockAnalysis [3][5] |
| 52-week range | $60.55 – $153.20 | As of Aug 12 (mid-range) [3] |
| Market cap | ≈$58.2B (~545.6M shares) | At the intraday quote, Aug 12 [3][5] |
| Balance sheet | Debt $35.07B (recourse $31.41B + non-recourse $3.66B); leases $16.54B; unrestricted cash $5.52B ($6.90B including restricted) | At Jun 30, 2026 — company results [1] |
| Enterprise value | ≈$104.3B lease-inclusive (net liabilities ≈$46.08B) — 4.0x EV/2027 consensus revenue | Aug 12 [1][5][11] |
| Analyst consensus | Buy; average target $142.54 (range $36 – $303, 38 analysts) | Aug 12 — StockAnalysis [11] |
Each figure is valid only at its stated time. Two independent feeds agree on the ~$107 price, the $90.32 prior close and an 18%-plus move; because these are intraday snapshots taken while the session was open, closing figures will differ.
The setup at a glance
| Question | Answer |
|---|---|
| What was the news? | Q2 2026 results after the close on Aug 11: revenue $2.575B (+112%), adjusted operating income $128M (5% margin), committed-contract backlog ~$104B (+246%), and full-year revenue guidance raised to $12.4–$13.2B [1][2]. |
| Was the revenue beat the reason? | Not on its own — $2.575B against ~$2.56B expected is a sub-1% beat. The margin trajectory, raised guidance, July pricing and backlog visibility together carried more weight [2]. |
| Did margins actually expand? | Sequentially, yes: adjusted operating margin recovered to 5% from the 1% Q1 trough. Year over year, no: the sequence runs 16% (Q2 2025), 6% (Q4 2025), 1% (Q1 2026), 5% (Q2 2026), and adjusted EBITDA margin fell to 59% from 62% [1][20]. |
| Was it a sector move? | Mostly company-specific, but not isolated from the sector. AI-infrastructure stocks were broadly higher, while CRWV materially outperformed the peers that were not reporting (CORZ +6.9%, APLD +3.7%, WULF +2.5% against a Nasdaq up 0.6%) [3][13]. |
| What is the bear case? | Capital intensity. $35–39B of 2026 capex on $12.8B of revenue, $35.07B of debt plus $16.54B of leases, and $640M of quarterly interest against $128M of adjusted operating income. DA Davidson estimates ~4% returns against a ~9% cost of capital; Bernstein kept an Underperform rating through the beat [1][2][9][17]. |
| How is it valued? | At the cited price, 4.0x EV/2027 consensus revenue on a lease-inclusive enterprise value of ~$104.3B, against a 38-analyst average target of $142.54 and a $36–$303 range. A funded-debt-only bridge would show 3.4x instead [5][11]. |
| When is the next catalyst? | Third-quarter results are likely in November on the normal quarterly cadence; CoreWeave had not announced the date as of Aug 12, 2026 [2]. |
CoreWeave (CRWV) stock FAQ
Why did CoreWeave (CRWV) stock jump on August 12, 2026?
CoreWeave rose about 18% to roughly $107 from a $90.32 prior close after reporting second-quarter results the previous evening. Revenue was $2.575 billion, up 112% year over year, with a committed-contract backlog near $104 billion and full-year guidance raised to $12.4-$13.2 billion. The revenue beat itself was slim — about 0.6% above the ~$2.56 billion consensus — so the weight fell on the margin trajectory, raised guidance, July price increases and backlog visibility. Adjusted operating margin recovered to 5% from 1% in the first quarter, with management guiding to low-teens by the fourth. By 12:27 p.m. ET turnover had already reached about 2.05 times the 20-day full-session average.
Did CoreWeave's margins actually improve?
Sequentially yes, year over year no. Adjusted operating margin recovered to 5% in Q2 2026 from about 1% in Q1 2026, which was the trough — but it stood at 16% in Q2 2025, so the year-over-year direction is still down. The full sequence is 16% in Q2 2025, 6% in Q4 2025, 1% in Q1 2026 and 5% in Q2 2026, which shows the deterioration began well before the trough quarter. Adjusted EBITDA was $1.51 billion, roughly double a year earlier in dollars, yet the margin slipped to 59% from 62%. Management guided adjusted operating margin to the low teens in the fourth quarter, which would remain below Q2 2025's 16% while comfortably exceeding Q4 2025's 6%.
Was the CoreWeave move part of a broader AI rally?
Mostly company-specific, but not isolated from it. AI-infrastructure stocks were broadly higher on August 12, and CoreWeave materially outperformed the peers that were not reporting results: Core Scientific rose 6.9%, Applied Digital 3.7% and TeraWulf 2.5%, all on below-average volume, while the Nasdaq Composite added about 0.6%. Super Micro's +12.7% came from its own fiscal Q4 report, and NVIDIA's +2.7% followed a $500 billion partnership announced on August 10 rather than a same-day catalyst. The defensible description is a large company-specific excess return on top of a positive sector tape.
What is CoreWeave's revenue backlog and why does it matter?
CoreWeave reported a committed-contract backlog of approximately $104 billion as of June 30, 2026, up 246% year over year, excluding more than $25 billion of net new customer commitments signed early in the third quarter. By the company's own definition this includes remaining performance obligations plus estimated future revenue under committed customer contracts, subject to delivery and availability-of-service requirements. It is not recognized revenue and not guaranteed cash, so the questions that matter are how much converts on schedule and how concentrated it is among a few large counterparties.
What is the bear case on CoreWeave stock?
Capital intensity and financing cost. CoreWeave guides to $35-39 billion of 2026 capex on $12.8 billion of revenue, carries $35.07 billion of debt plus $16.54 billion of lease liabilities against $5.52 billion of unrestricted cash, and paid $640 million of interest in a quarter when it earned $128 million of adjusted operating income. DA Davidson, holding a $100 target, argues that if incremental returns remain below the firm's estimated cost of capital — it sees roughly 4% returns against a cost of capital nearer 9%, with levered free cash flow around negative $10.6 billion — continued investment would destroy rather than create value. Bernstein raised its price target through the beat but kept an Underperform rating.
What price targets do analysts have on CRWV?
The dispersion is unusually wide. On August 12, 2026, Wells Fargo raised its target to $160 from $155 (Overweight), Piper Sandler to $153 from $151 (Overweight), Baird to $130 from $100 (Outperform), JPMorgan to $120 from $110 (Neutral), Mizuho to $115 from $100 (Neutral), and Bernstein to $74 from $67 while keeping an Underperform rating. DA Davidson maintained $100 (Neutral) and Rosenblatt maintained $250 (Buy), the highest in that set. Across all 38 analysts covering the stock the average target is $142.54, with a range of $36 to $303 — a spread that reflects genuine disagreement about whether the business earns its cost of capital.
Is CoreWeave profitable?
Not on a GAAP basis. CoreWeave reported a net loss of $626 million in the second quarter of 2026, widened from $290 million a year earlier, largely because of $640 million in quarterly interest expense on its debt-funded build-out, and GAAP diluted EPS of $(1.14). On adjusted measures it shows a profit at the operating line: adjusted EBITDA of $1.51 billion (a 59% margin) and adjusted operating income of $128 million (a 5% margin), against an adjusted net loss of $567 million. The company does not publish an adjusted EPS metric; the roughly $1.03 adjusted loss per share widely quoted comes from third-party compilations such as Zacks and LSEG. The gap between adjusted operating income and interest expense is the central financial question facing the company.