Stock Analysis
Why did Dell stock drop 9.8% on July 15, 2026? An IBM-driven rally reversed
Dell closed down 9.80% at $412.68 on Wednesday with no confirmed fresh Dell-specific catalyst. Most of the move reversed Tuesday's 7% rally — which itself rested on a rival's warning, not Dell's news. Here is what the tape and the Form 4s actually show.

Summary
Dell Technologies (NYSE: DELL) closed at $412.68 on Wednesday, July 15, 2026, down $44.86 — a 9.80% decline from Tuesday's $457.54 close, erasing roughly $29 billion of market value, though it finished about 5.5% above its $391.12 intraday low [2]. As of that close, no confirmed fresh Dell-specific operational catalyst had been identified: Dell has filed no 8-K since July 6, and issued no guidance update, pre-announcement or operational disclosure [14].
Tuesday's session is essential context for Wednesday's. Dell rose 7.12% on July 14 to $457.54 [19] — not on its own news, but on a read-through from a rival's. IBM pre-announced a preliminary second-quarter miss that morning, and its chief executive attributed it to a late-June client shift of capital spending into supply-constrained servers, storage and memory [23][24]; investors bought the hardware names those categories imply, Dell among the strongest, on roughly 7.2 million shares — below Dell's recent average [25]. Measured from Monday's $427.11 close, the two-day round trip through Wednesday is only about −3.4% [19]. A thin, below-average-volume rally on borrowed news, largely given back.
What changed
| Metric | Value | As of / source |
|---|---|---|
| Closing price | $412.68 | Jul 15 2026, 4:00 p.m. ET — StockAnalysis [2] |
| Prior close (Jul 14) | $457.54 | Confirmed on two independent feeds [1][2] |
| Day's change | −$44.86 / −9.80% | Close vs prior close [2] |
| Day's range | $391.12 – $461.20 | Closed ~5.5% off the low [2] |
| 52-week range | $110.22 – $469.47 | High set Jun 1 2026 [2][19] |
| Volume | 12,829,075 sh | Jul 15 2026 close — 1.61× the 20-day average [2][3] |
| 20-day average volume | 7,963,169 sh | Jul 15 2026 — StockAnalysis [3] |
| Market cap | ~$266.65bn | Jul 15 2026 close — StockAnalysis [2] |
The IBM read-through, and the explanations that do not hold
On July 14, IBM fell about 26% after pre-announcing a preliminary Q2 miss, and chief executive Arvind Krishna tied it to clients reprioritising capital spending in late June toward supply-constrained servers, storage and memory [23]. Our coverage that afternoon noted the three categories he named were the day's strongest, Dell up about 7% among them [24]. That was a second-hand read — a competitor's shortfall interpreted as Dell's opportunity, an inference about demand rather than a disclosure from Dell — and it was acted on with below-average conviction. Below-average volume weakens the confirmation behind a move; it does not, by itself, explain Wednesday's reversal.
The three explanations aired on Wednesday [5] are each real but none is new: reports that Meta may lease surplus AI capacity are dated July 1 [10][11], and Dell rose after them (up 3.52% on July 8 and 4.22% on July 9) [19]; the GF Securities downgrade to Hold is dated June 25, when it knocked the stock 5.67% close-to-close [8][9], and Yahoo's desk called it "older news and not today's trigger" [4]; and the insider selling is Silver Lake — real, but worth reading from the filings.
The Silver Lake sales, read from the filings
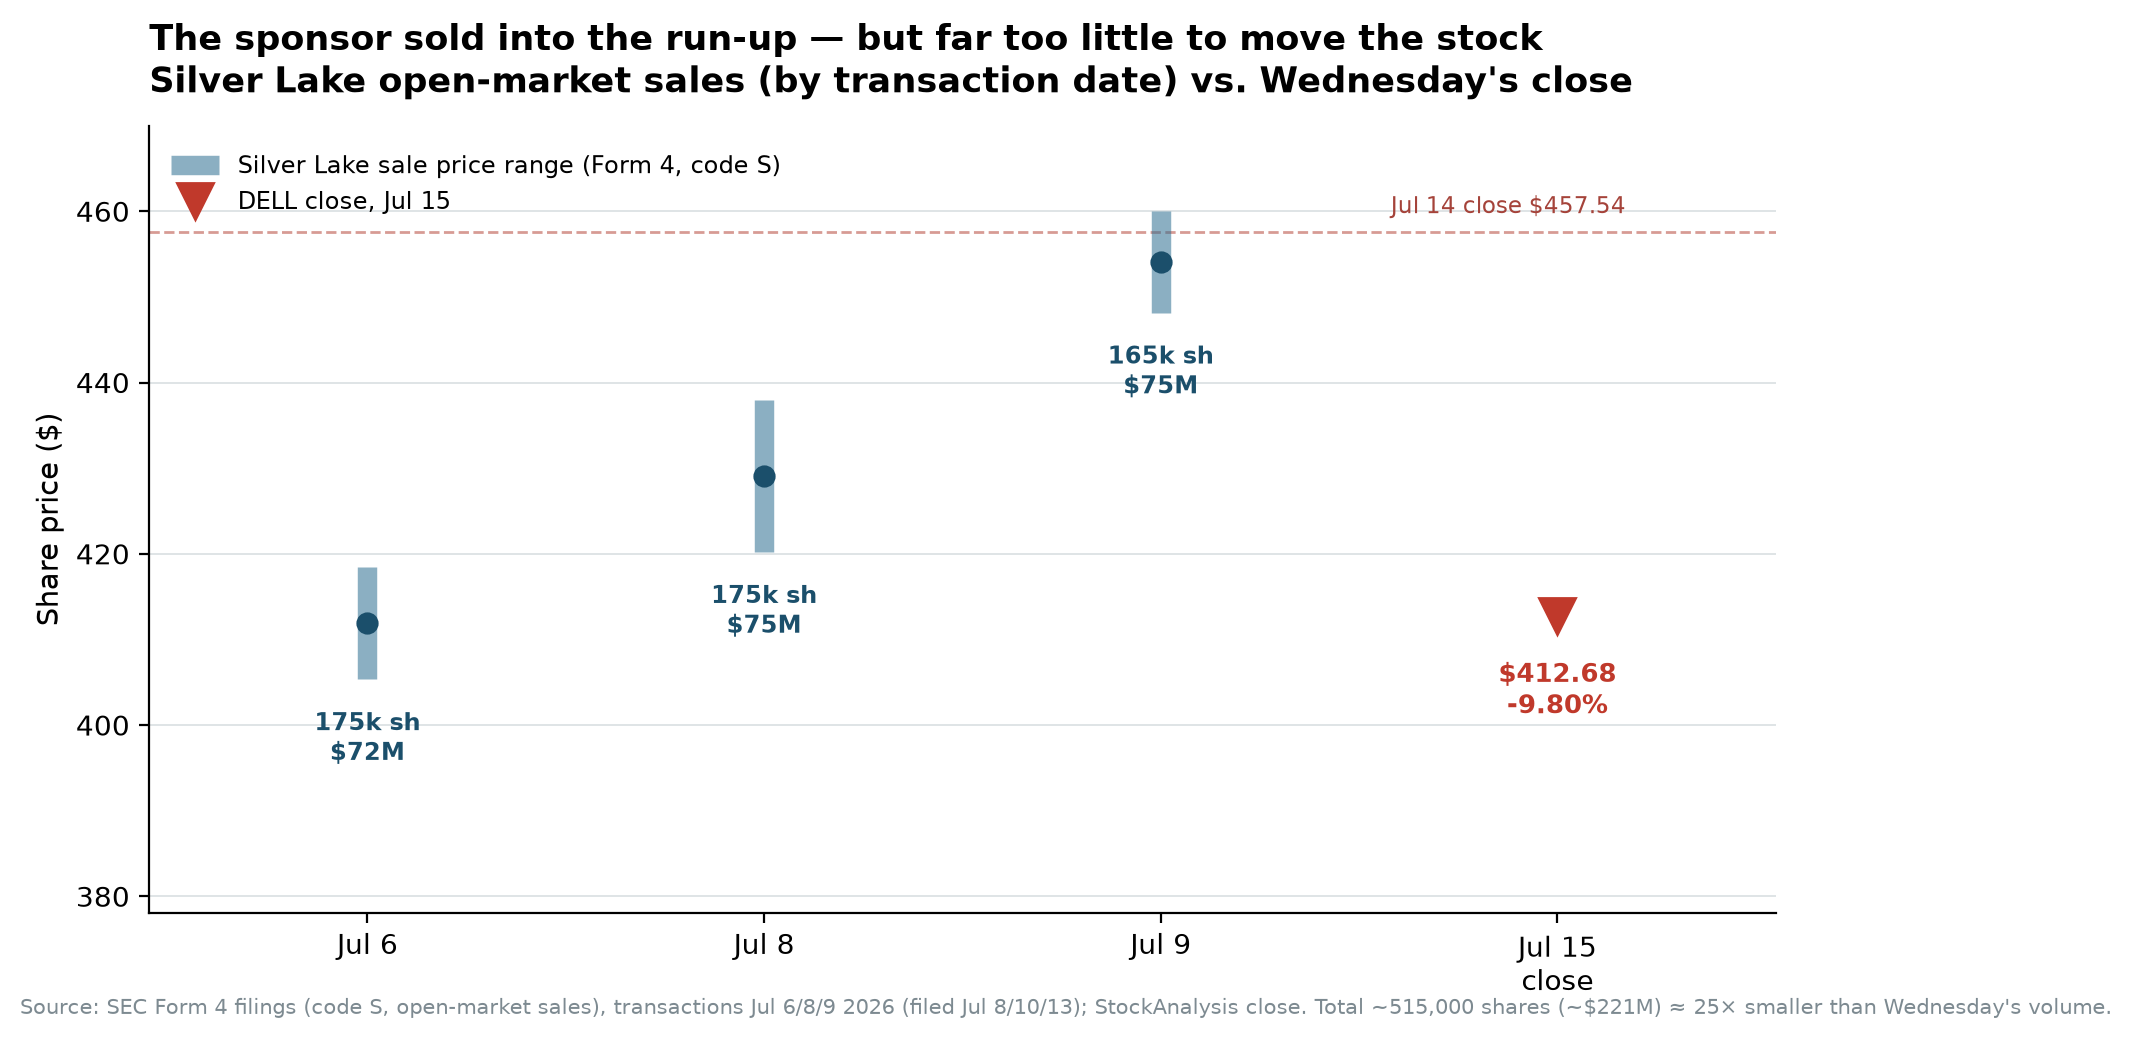
Reading Dell's Form 4 XML directly from EDGAR, and keying on the transaction date rather than the later filing date, here is what the sponsor actually did:
| Transaction date | Code | Shares | Value | Price range | Form 4 filed |
|---|---|---|---|---|---|
| Jul 6 | S — open-market sale | 174,997 | ~$71.8M | $405.36 – $418.49 | Jul 8 [12] |
| Jul 8 | S — open-market sale | 174,998 | ~$74.8M | $420.21 – $438.00 | Jul 10 [12] |
| Jul 9 | S — open-market sale | 165,000 | ~$74.8M | $448.17 – $460.02 | Jul 13 [12] |
| Jul 10 | J — distribution, no price | 201,173 | n/a | n/a | Jul 14 [13] |
| Total open-market (code S) | ~515,000 | ~$221.4M |
The seller is Silver Lake, the sponsor from Dell's 2013 take-private, reducing a legacy stake through pre-noticed sales, with Form 144 notices filed alongside [14]. Only the code-S (open-market sale) legs are counted: the same filings carry code-M derivative conversions made "in connection with" the sales, so adding them would count the source shares and their sale twice. The total is written as "approximately 515,000" because the Form 4 rows sum to 174,997 and 174,998 where the Form 144 tables report exactly 175,000 — a five-share difference, immaterial but worth stating. The July 14 entry is a code-J distribution at no stated price, filed twice only because EDGAR caps reporting persons per Form 4 at ten; both describe the same 201,173 shares — one transaction, not two.
The scale is the point. About 515,000 shares is roughly 25 times smaller than Wednesday's volume and about 15 times smaller than a single average session [3]. The reported sales were too small to explain Wednesday's decline mechanically by themselves, though sponsor selling can still shape sentiment or the perception of future supply.
How the move sat against the market
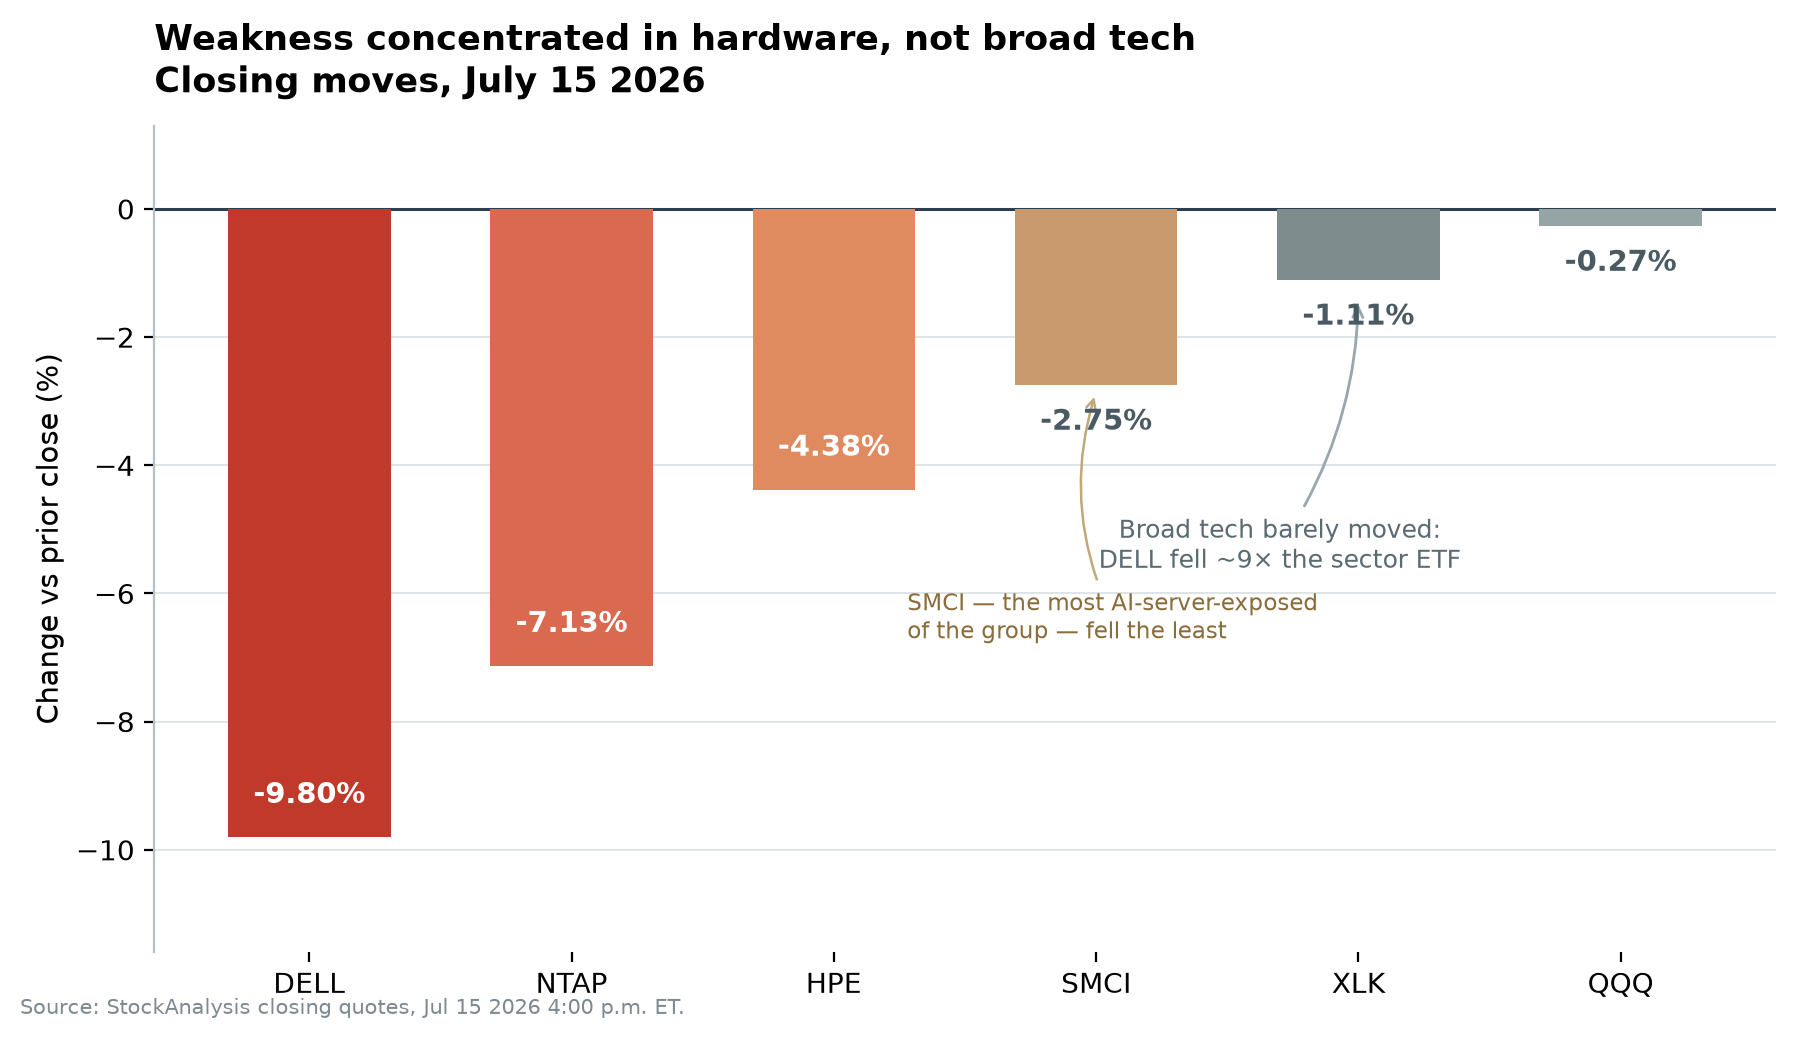
Dell materially underperformed broad technology benchmarks: the Technology Select Sector SPDR (XLK) fell 1.11% and the Nasdaq-100 proxy (QQQ) 0.27% [27][18], so Dell dropped roughly nine times the sector ETF. But those benchmarks are too broad to rule out a factor reversal in hardware and AI infrastructure specifically — and there was one across hardware and memory names that day. Nor does the peer set resolve into a tidy story: NetApp fell 7.13%, close to Dell, while Super Micro — arguably the most AI-server-exposed comparable in the group — fell only 2.75% [15][20]. A simple "AI-server exposure explains the damage" reading does not survive that.
Analyst view
What can be said with confidence is narrow. As of the close, no fresh Dell-specific operational catalyst had been identified; Tuesday's 7.12% advance rested on a competitor's disclosure rather than Dell's own and came on below-average volume; and Wednesday's decline came on 1.61× average volume, closing above its low [2][3]. What cannot be said is that "positioning" caused the move. Profit-taking and the trimming of a crowded, heavily-appreciated trade are plausible contributors after a rally of this size, but volume measures how much stock changed hands, not who traded it or why. The close above the low shows the decline was not uninterrupted; it does not identify whether the selling was discretionary, systematic or forced.
The unresolved question the day gestures at is genuine and was not answered on Wednesday: whether hyperscaler capacity leasing eventually compresses AI-server demand, and whether component costs keep pressuring a gross margin that was 17.75% on a GAAP basis last quarter against 21.12% a year earlier [26]. Those are the things a Q2 print will speak to; a quiet Wednesday did not.
What this means for value
Dell guided fiscal 2027 to $165–169bn of revenue and about $17.90 of non-GAAP diluted EPS, with ~$60bn of AI server revenue, after a Q1 that delivered $43.8bn of revenue (+~88% year-over-year), $16.1bn of AI-optimised server revenue (+757%), $24.4bn of new AI orders and a $51.3bn backlog [21][22]. The scenarios below apply a multiple to that non-GAAP guided figure — not to a data vendor's forward-P/E field, whose earnings denominator is a different period. The probabilities are the author's illustrative estimates, not forecasts, and they sum to 100%.
| Scenario | Multiple on $17.90 | Price | Probability | Key driver |
|---|---|---|---|---|
| Bull | 28× | ~$501 | 30% | Backlog converts, AI revenue beats $60bn, supply eases, margins hold — near Evercore's $500 (Jul 8) [6][7] and the $500 targets from Goldman, Mizuho and Bernstein (Jun 1) [17] |
| Base | 24× | ~$430 | 45% | Guidance met, gross margin holds near current levels; below Morgan Stanley's $477 (Jun 23) [17] |
| Bear | 16× | ~$286 | 25% | Capex digestion slows orders, component costs compress margin further, multiple derates toward core-hardware levels [8] |
| Probability-weighted value ≈ $415 — versus the $412.68 close, essentially in line. | ||||
The number to take from this is not $415 but the width around it. At Tuesday's $457.54, price sat roughly 10% above this blend; after Wednesday it sits on top of it. The scenarios span about $215 a share, from $286 to $501, and the Street's own published targets run from $213 to $700 around a $487.26 average of 27 analysts as of July 15, 2026 [2][17]. Treat the blended figure as the midpoint of a genuinely wide distribution — driven chiefly by backlog conversion, AI-server margins and the multiple investors assign to those earnings — not as a price objective.
What to watch
- Q2 FY2027 results (expected late August) — the print that resolves the margin question, after GAAP gross margin fell to 17.75% last quarter from 21.12% a year earlier [26].
- The $51.3bn AI backlog and order pace [21] — conversion supports the bull case, while any sign that hyperscaler capacity leasing is displacing new orders would provide evidence for the bear case.
- Whether a Dell-specific disclosure emerges — an 8-K, guidance change or dated analyst action explaining Wednesday would falsify this piece's central claim that none had been identified as of the close.
Frequently asked questions
Why did Dell stock fall on July 15, 2026?
Dell closed down 9.80% at $412.68 with no company catalyst — it filed no 8-K after July 6 and issued no guidance update. Most of the decline reversed Tuesday's 7.12% rally, which had itself rested on a read-through from IBM's preliminary Q2 warning rather than any Dell news. Measured from Monday's close, the two-day round trip was only about −3.4%.
Why did Dell rise on July 14 and fall the next day?
On July 14, IBM pre-announced a preliminary Q2 miss and its CEO blamed a late-June client shift of spending into supply-constrained servers, storage and memory. Investors bought the hardware names that implied, Dell among them, lifting it 7.12% — but on below-average volume of about 7.2 million shares. A thin rally built on a rival's disclosure gave much of it back on Wednesday.
Did the Meta AI capacity story or the GF downgrade cause Dell's drop?
Neither is new. The reports that Meta may lease surplus AI compute are dated July 1 — Dell rose after them, gaining 3.52% on July 8 and 4.22% on July 9. The GF Securities downgrade to Hold is dated June 25, when it knocked the stock 5.67% that day. Three weeks and two weeks old respectively, they are not July 15 catalysts.
Was Dell's fall caused by insider selling?
No — the selling is real but far too small. Silver Lake, the sponsor from Dell's 2013 take-private, sold about 515,000 shares (~$221 million) in open-market transactions on July 6, 8 and 9, with Form 144 notices filed. That is roughly 25 times smaller than Wednesday's volume and about 15 times smaller than a single average session. The July 14 filing is a code-J distribution, not a market sale.
What is Dell's fair value after the drop?
Applying multiples to Dell's non-GAAP FY2027 EPS guidance of $17.90 gives an illustrative bull case of ~$501 (28×, 30%), base of ~$430 (24×, 45%) and bear of ~$286 (16×, 25%), for a probability-weighted value of about $415 — essentially in line with the $412.68 close. At Tuesday's $457.54 close, price sat about 10% above that blend. Street consensus is $487.26 across 27 analysts, with a wide $213–$700 range. These probabilities are illustrative estimates, not forecasts.