Stock Analysis
Why did Cadence Design Systems (CDNS) stock fall ~10% on July 17, 2026 — Kimi K3 and the EDA selloff?
Cadence fell about 10% intraday on July 17, 2026 — far more than the broad chip group, which pared its morning losses. Market coverage tied the EDA pair's underperformance to Moonshot's Kimi K3, which the company says designed a 45nm chip in simulation using only open-source tools. It's an early, reported proof of concept, set against a broad semiconductor retreat — and it overwhelmed Cadence's own Rapidus AI partnership and Benchmark's $450 Buy call.

Summary
Cadence Design Systems (NASDAQ: CDNS) was trading around $327.60 early Friday afternoon, July 17, 2026, down about $37, or roughly 10.2%, from Thursday's $364.65 close — with the session still open [1][2]. It had been as low as $320.07 (about −12.2%) earlier in the day [2]. The BestStocks feed caught the move at the open as a generic "sector headwinds" decline [1]. The size of it was more specific than that: Cadence and its duopoly counterpart — and principal EDA rival — Synopsys (SNPS), down about the same, fell far harder than the broad chip group, and market coverage pointed at their own software moat [5][8].
The catalyst under discussion was a demonstration, not an earnings miss. On July 17 China's Moonshot AI released Kimi K3 — which Moonshot describes as the first open 3-trillion-parameter-class model (about 2.8 trillion parameters) — and reported that, in a roughly 48-hour autonomous run, it built and verified a chip design in simulation using only open-source tools, an "early proof of concept" in its own words [5][12]. For two companies whose value rests on proprietary design toolchains, that headline put a question mark over the bull thesis — that ever-more-complex AI chips must be designed on their licensed software. The broader chip selloff contributed; CDNS and SNPS's relative underperformance was consistent with an additional, EDA-specific concern layered on top [9]. The irony: the drop came the day after Benchmark's Buy initiation at a Street-high $450 target was reported, and the morning after Cadence itself announced a positive AI partnership with Rapidus [4][6].
| Evidence level | What can be said |
|---|---|
| Documented | CDNS traded down ~10% intraday (about −12% at its session low) while SNPS fell about the same and the broad chip names pared losses to low single digits; Cadence announced a Rapidus partnership (Jul 16) and Benchmark's $450 Buy initiation was reported (Jul 16) [2][8]. |
| Reported interpretation | Market coverage tied EDA's underperformance to Moonshot's Kimi K3 demonstration, set against a broad semiconductor retreat (AI-capex worries, rich valuations, geopolitics) — Kimi K3 was one contemporaneous factor, not the only identified cause [5][9]. |
| Author inference / not measurable | The thesis that open-source automation could eventually erode EDA pricing power is an inference. How much of the ~10% is the Kimi K3 scare, how much the broad risk-off, and how much pre-earnings de-risking cannot be isolated from the tape. |
What changed
| Metric | Value | As of / source |
|---|---|---|
| Intraday price | ~$327.60 | Jul 17 2026, ~3:25 p.m. ET — StockAnalysis [2] (session open) |
| Prior close (Jul 16) | $364.65 | StockAnalysis [2] |
| Intraday change | −$37.05 / −10.16% | Vs prior close; as low as −12.2% ($320.07) earlier [2] |
| Day's range | $320.07 – $342.29 | The low is ~12.2% below Thursday's close [2] |
| 52-week range | $262.75 – $416.69 | ~21% below the high [2] |
| Volume | ~3.9M sh by ~3:25 p.m. | Vs a ~2.3–2.4M average (Finviz / MarketWatch) — heavy turnover, tracking toward ~1.8–2× a full session [2][3] |
| Market cap | ~$90.4bn | P/E ~85× trailing / ~45× forward (StockAnalysis; ~76× trailing on the live price) [2] |
| Analyst consensus | ~$395 avg PT | Strong Buy; $394.79 across 26 analysts, range $275–$470 — Investing.com / StockAnalysis [2][7] |
Participation was heavy but not a blow-off. Cadence had traded roughly 3.9 million shares by mid-afternoon against a ~2.3–2.4 million-share average, i.e. an above-average-participation down day tracking toward perhaps 1.8–2× normal for the full session — real repositioning, not a thin, low-conviction drift [2][3]. It is worth correcting a common misconception about the setup: Cadence did not come into Friday on a fresh spike. It was up roughly 17% year to date but about 6% lower over the prior month (from ~$389.60 in mid-June to Thursday's $364.65) — a premium, long-duration name, but not one that had just run vertical [14].
The catalyst: an AI model that Moonshot says designed a chip in simulation
The move only makes sense once you separate the EDA pair from the broader chip selloff. What was cited against Cadence and Synopsys specifically was Moonshot AI's Kimi K3 demonstration. By Moonshot's own account, in a roughly 48-hour autonomous run the model built, optimized and verified a 45nm design that met its timing and throughput targets in simulation, using an open-source flow and the freely available Nangate 45nm Open Cell Library — and, Moonshot says, without licensed Cadence or Synopsys software in the loop [5]. Cadence's Genus, Innovus and Virtuoso tools, and Synopsys's Design Compiler and IC Compiler, are exactly the software chipmakers normally pay for to do that work [5].
Two cautions matter here, and the article carries them deliberately. First, this is a reported, early proof of concept, not an independently verified production result: the primary source does not establish that a physical chip was fabricated, that the design was taped out to a foundry, that any third party reproduced it, or exactly which open-source tools touched which step — and Moonshot itself frames it as an "early proof of concept" [5]. Second, the model is an announced open-weight release: Moonshot says the full weights are due by July 27, with a technical report to follow, so the methodology is not yet public [5][12]. Still, the question it raised — whether rising AI-chip complexity really must run on proprietary tools — is precisely the one Cadence's bull case answers "yes," and that is why the two EDA names underperformed [5]. The scare also dropped into a market already dumping the AI trade: on the same Friday the Philadelphia Semiconductor Index fell as much as ~5.7% intraday before recovering to roughly flat, and it sits more than 20% below its late-June record — a bear-market drawdown, its worst week since March 2025 — as investors questioned the return on heavy AI-infrastructure spending [9][10].
It was an EDA-specific move, not just a chip selloff
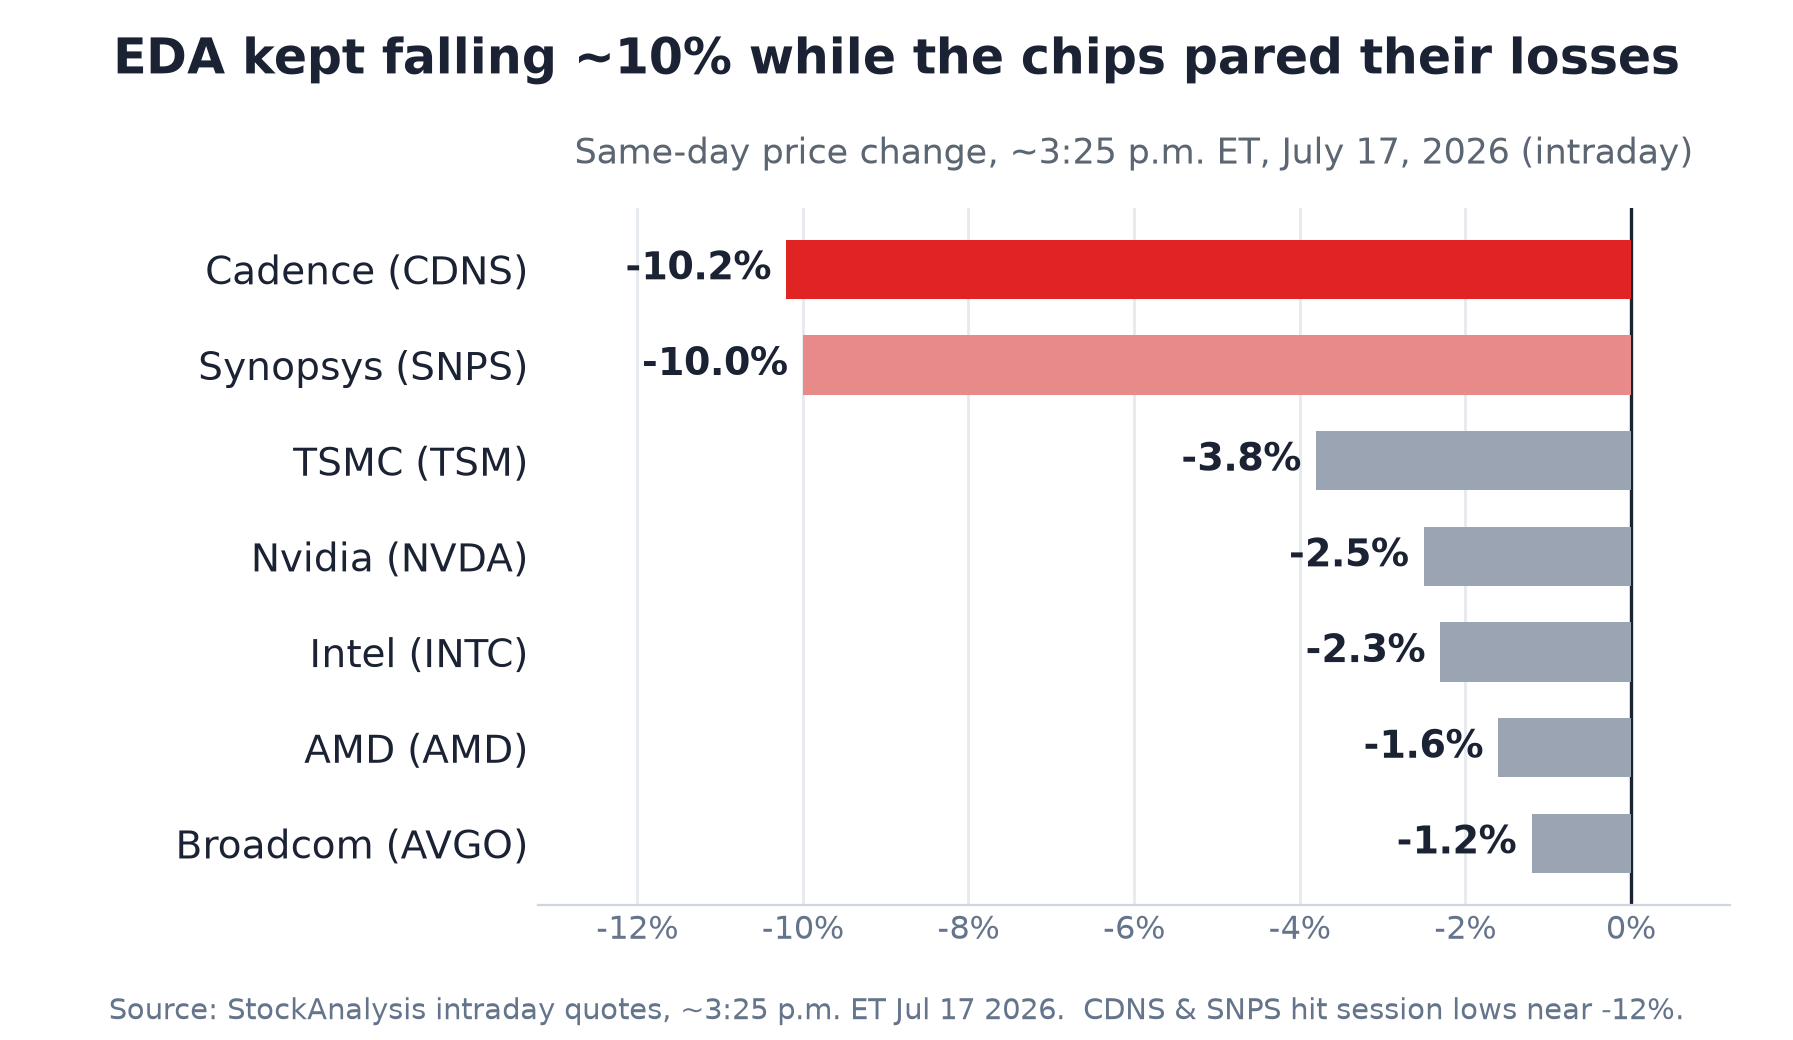
The cleanest way to see the EDA-specific damage is a same-timestamp peer tape. If Friday were purely a semiconductor beta event, Cadence would have moved with the chips. It moved with Synopsys instead. Measured at roughly the same moment (~3:25 p.m. ET), the two EDA names were down about 10% while the actual chipmakers had pared their morning losses to low single digits: Nvidia about 2.5%, Broadcom about 1.2%, AMD about 1.6% and Intel about 2.3%, with TSMC off around 3.8% [8]. Earlier in the day the whole complex was weaker — at their session lows CDNS and SNPS were down about 12% versus roughly a 5.7% low for the SOX, about twice as much — but the chips recovered through the afternoon while the EDA pair did not [2][10].
The broad backdrop was real and worth naming, because it set the mood. Reuters documented a global semiconductor retreat driven by several simultaneous factors — reduced AI bets, rich valuations, questions over AI-capex sustainability and geopolitical escalation — of which Kimi K3 was one contemporaneous element, not a sole cause [9]. Even Netflix fell sharply the same day on a soft guide, a reminder that high-multiple growth names of every stripe were under pressure [1]. The relative underperformance of the EDA pair suggests an additional, EDA-specific component on top of that beta — but that component cannot be isolated precisely from the tape. This is the same AI-trade unwind and semiconductor risk-off that has whipsawed the sector all month — with an EDA-specific question layered on top.
The bull case Cadence still has
Set against the scare are three things that did not change on Friday, and they are the reason to be careful shorting the narrative. First, the 45nm caveat: the node in the Kimi K3 demonstration is several generations behind the 3nm and 2nm frontier where AI accelerators are actually designed, and where Cadence and Synopsys tools are deepest and hardest to replicate with open-source flows; a 45nm digital standard-cell exercise does not test synthesis, place-and-route, extraction, timing, power, analog/custom design, packaging and foundry-qualified signoff across a full production flow [5]. Analysts covering the demonstration, per Investing.com, saw no immediate threat to either company's revenue base; the risk is a long-dated shift in where design-software value sits, not a 2026 problem [5]. Second, the demand tailwind: Goldman Sachs estimated a roughly $3.7 billion annual EDA-industry revenue opportunity by 2030 tied to alleviating a structural shortage of chip designers, with Cadence and Synopsys the beneficiaries — AI that makes each designer more productive is, on that view, a tailwind, not a substitute [11].
Third, Cadence's own AI news cuts the other way from the scare. The morning before the drop, Cadence and Japan's Rapidus announced a partnership embedding Cadence's InnoStack AI Super Agent into Rapidus's agentic design solution, with Rapidus targeting up to a 2× improvement in design turnaround time for advanced-node SoCs — Cadence selling agentic AI, not being disrupted by it [6]. And the sell-side was constructive right up to the move: Benchmark's Gary Mobley initiated at Buy with a $450 target, reported July 16, citing the duopoly's high barriers to entry, ~86% gross margins and pricing power, and the "step-function" productivity gain AI could bring to design tools [4]. Separately, Stifel's $432 target (up from $395) dates to June 9, after Cadence's Intel 14A collaboration — a standing bullish target, not a Friday reaction [7]. None of that changed because a 45nm test design made headlines.
What this means for value
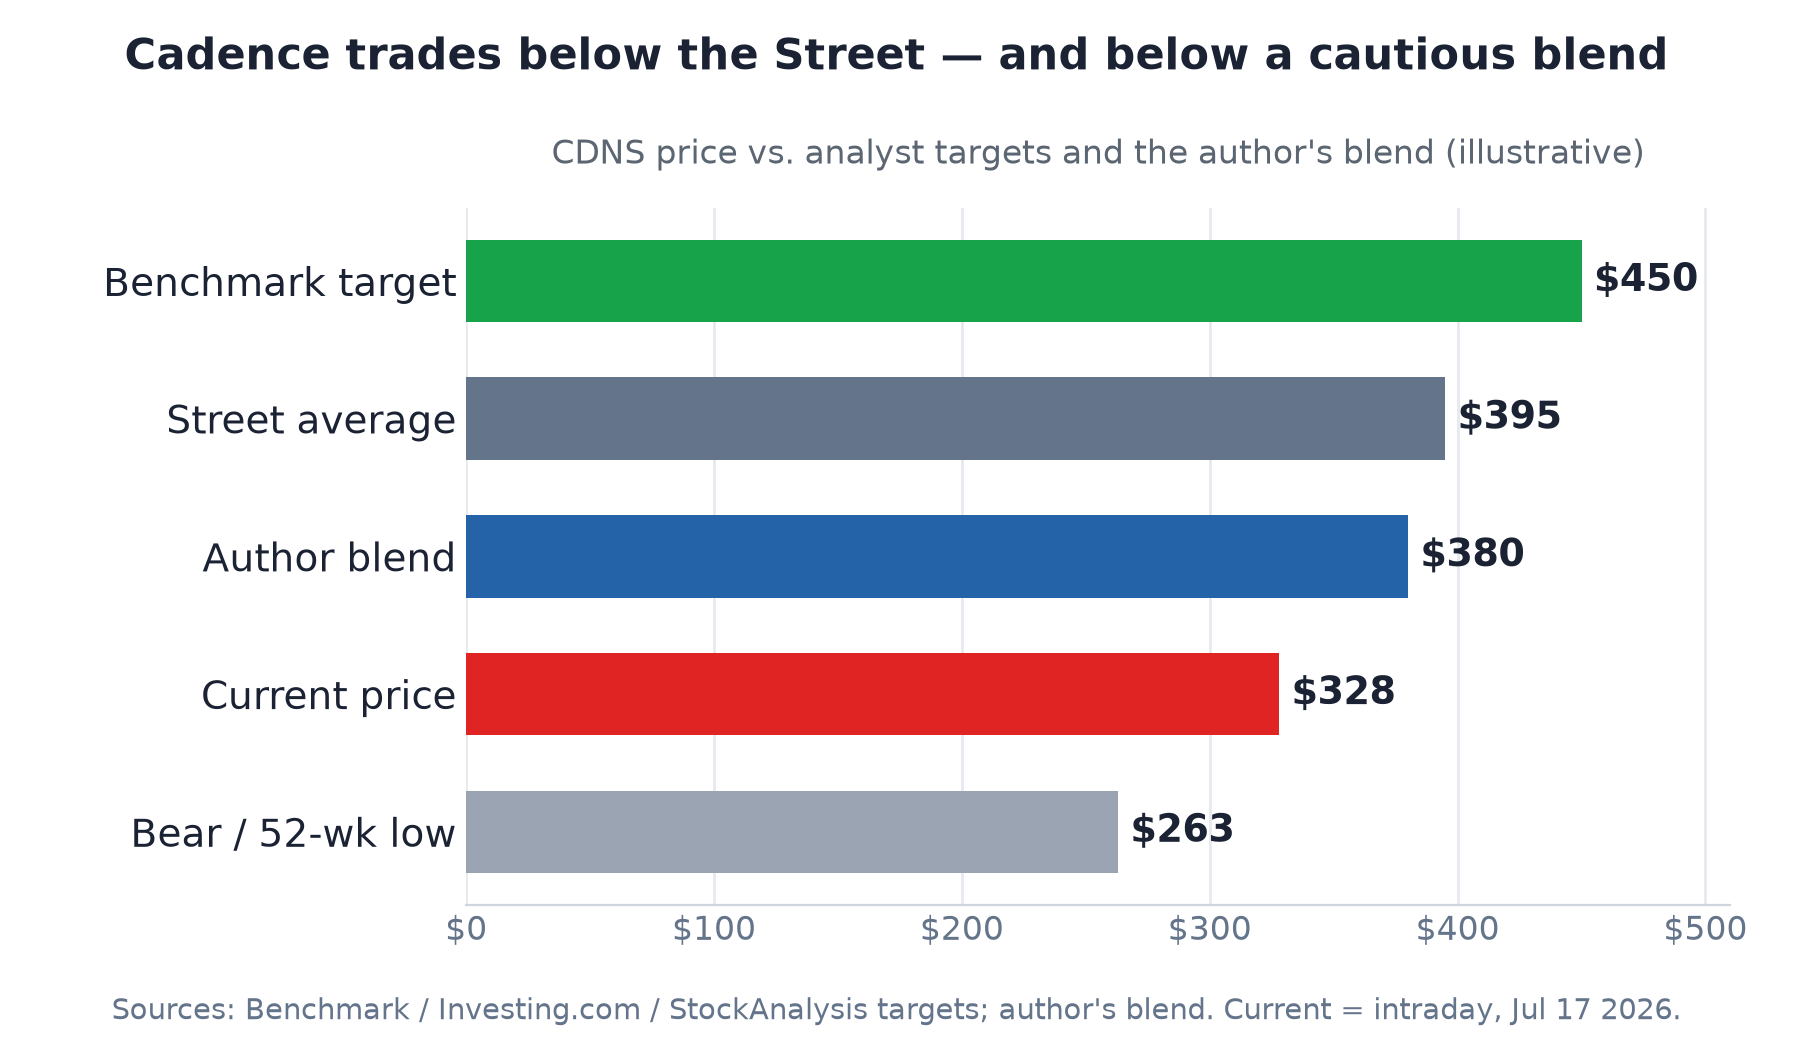
Cadence still earns a premium multiple for defensible reasons — a two-player market, ~86% gross margins, recurring software revenue and a compounding role in every advanced chip — so the debate is about the durability of the moat and the multiple the market will pay for it, not solvency. The scenario prices below are the author's own illustrative estimates, anchored to the published target distribution (low ~$275 to a Street high of $470, ~$395 average across 26 analysts) and to whether the open-source threat proves real at the leading nodes — not derived from a formal model. They sum to 100%.
| Scenario | Price | Probability | Key driver |
|---|---|---|---|
| Bull | ~$450 | 30% | The market dismisses Kimi K3 as a 45nm proof of concept; AI drives the "step-function" productivity gain in EDA that Benchmark describes, the Goldman designer-shortage tailwind builds, and a strong July 27 print reaffirms the moat — back to the Street high [4][11] |
| Base | ~$395 | 45% | The duopoly moat holds at leading nodes and growth continues, but the multiple compresses modestly from ~80× as AI-spend euphoria cools — landing near the ~$395 consensus [2][7] |
| Bear | ~$270 | 25% | The open-source / AI-design narrative gains traction, the premium multiple de-rates toward the $262.75 52-week low, and a deepening semiconductor bear market drags AI design-activity growth [2][9] |
| Probability-weighted scenario value ≈ $380 (the author's illustrative estimate, not an objective fair value) — the ~$328 price sits about 14% below it and ~17% below the ~$395 Street average, i.e. roughly +16% and +21% of upside to reach them, with the $270 bear ~18% lower. | |||
Read the blend cautiously, and mind the convention: "14% below the blend" and "17% below consensus" describe the gap, which is not the same as expected upside (that is ~16% and ~21% from the current price). At ~$380 the blend sits above the price, so on these assumptions Friday's selloff has pushed Cadence below a defensible value — the moat scare looks over-priced if the moat holds. But the gap down to the bear case is real, which is the market's way of saying it is no longer treating leading-node EDA dominance as a certainty. The distance between the three numbers — ~$328 today, ~$380 on a cautious blend, ~$395 on the Street — is the whole debate, and it resolves on evidence about the moat at 3nm/2nm, not on any single quarter. Treat the ~$380 figure as an illustrative probability-weighted scenario value, not a target or a model output.
What to watch
- July 27 — a double catalyst: Cadence reports Q2 2026 (webcast 2 p.m. PT) the same day Moonshot's Kimi K3 full weights are due, with a technical report to follow. The earnings call (backlog, EDA renewal trends, any commentary on open-source competition) and the eventual methodology detail on how much licensed software the demo truly avoided will together set the tone [5].
- Whether the open-source flow scales beyond 45nm — the single biggest swing factor between the scenarios is any evidence (or lack of it) that autonomous, open-tool design reaches the 3nm/2nm nodes where Cadence and Synopsys are entrenched [5].
- Workflow automation vs the underlying engines — watch whether the threat is framed as automating the use of EDA tools (which need not cut EDA spending) or as replacing the engines, foundry certifications, IP and signoff liability (which would). The two are very different for revenue [5].
- Synopsys as a read-through — the two EDA names now trade as a pair on this theme; SNPS's reaction into and out of its own results is a cleaner sentiment gauge than Cadence alone [13].
- Whether the multiple stabilises — after the drop CDNS is no longer priced for perfection; watch whether it holds the ~$320–$330 area or keeps de-rating toward the ~$263 52-week low [2].
Frequently asked questions
Why did Cadence Design Systems (CDNS) stock fall on July 17, 2026?
Cadence was down about 10% intraday to roughly $328 — with fellow EDA maker Synopsys off about the same — after Moonshot AI's newly released Kimi K3 model was reported to have designed a 45nm chip in simulation over about 48 hours using only open-source tools, an early proof of concept in Moonshot's own words. Because both companies' valuations rest on their proprietary design software, the demonstration raised a question over that moat. It landed on a stock near 80x earnings during a broad semiconductor retreat, and the two EDA names fell far harder than the chipmakers, which pared their morning losses to low single digits by mid-afternoon.
Was the Kimi K3 chip physically manufactured?
No. By Moonshot AI's account, Kimi K3 produced and verified a 45nm design in simulation over a roughly 48-hour autonomous run — an early proof of concept. The primary source does not disclose a fabricated chip, a foundry tape-out, independent reproduction, or successful production signoff, and the exact open-source toolchain and verification steps were not public as of writing. Treat it as a reported simulation result, not confirmed silicon.
Were Kimi K3's full model weights and chip-design files publicly available?
Not yet at the time of the move. Moonshot said Kimi K3's full open weights are due by July 27, with a technical report to follow, so 'announced open-weight model' is the accurate description until then. The detailed chip-design methodology — including exactly which open-source tools were used at each step — awaits that report, which is expected the same day Cadence reports Q2 earnings.
Does the Kimi K3 open-source chip design actually threaten Cadence and Synopsys?
Not immediately, and that is the key nuance. The demonstration used a 45nm process — several generations behind the 3nm and 2nm nodes where AI accelerators are actually designed and where Cadence's and Synopsys's tools are deepest and hardest to replicate — and a standard-cell exercise at that node does not test a full production flow. Analysts covering the news, per Investing.com, saw no near-term threat to either company's revenue; the risk is a longer-dated shift in where design-software value sits. Moonshot's full weights and technical report, due around July 27, will help clarify how real the threat is.
Was the Cadence drop part of the broader semiconductor selloff?
Partly, but the size of the move was EDA-specific. Reuters documented a broad semiconductor retreat on July 17 driven by several factors — reduced AI bets, rich valuations, AI-capex sustainability questions and geopolitics — and the Philadelphia Semiconductor Index fell as much as about 5.7% intraday before recovering to roughly flat. Yet at a same-timestamp read around 3:25 p.m. ET, Nvidia was down about 2.5%, Broadcom about 1.2%, AMD about 1.6% and Intel about 2.3%, while Cadence and Synopsys were down about 10%. That gap is the EDA-specific concern layered on top of the general risk-off.
What did analysts say about Cadence around the drop?
The sell-side was constructive right up to the selloff. Benchmark's Gary Mobley initiated coverage at Buy with a Street-high $450 target, reported July 16 — the day before the move — citing the EDA duopoly's high barriers to entry, roughly 86% gross margins, pricing power, and a potential AI-driven 'step-function' in design productivity. Stifel's $432 target (up from $395) dates to June 9, after Cadence's Intel 14A collaboration. The consensus is Strong Buy with an average target of about $395 (Investing.com: $394.79 across 26 analysts, range $275–$470) — roughly 21% above the ~$328 intraday price. None of those calls were changed by the Kimi K3 demonstration.
Is Cadence stock cheap after the July 2026 drop?
It depends entirely on your view of the EDA moat. Around $328 the stock trades about 17% below the ~$395 consensus target — roughly 21% of upside to reach it — and well under Benchmark's $450. On the author's more cautious probability-weighted scenario value (bull $450 at 30%, base $395 at 45%, bear ~$270 at 25%, blended ~$380), the price sits about 14% below that blend, or ~16% of upside, but only ~18% above the bear case. With Cadence still on a high-double-digit forward multiple, it is not obviously cheap in absolute terms; the debate resolves on whether the moat holds at leading nodes. These figures are illustrative descriptive analysis, not investment advice.