Materials
Newmont (NEM) Stock Jumps ~7%: A Gold Surge, a $6B Buyback, and the Barrick Settlement
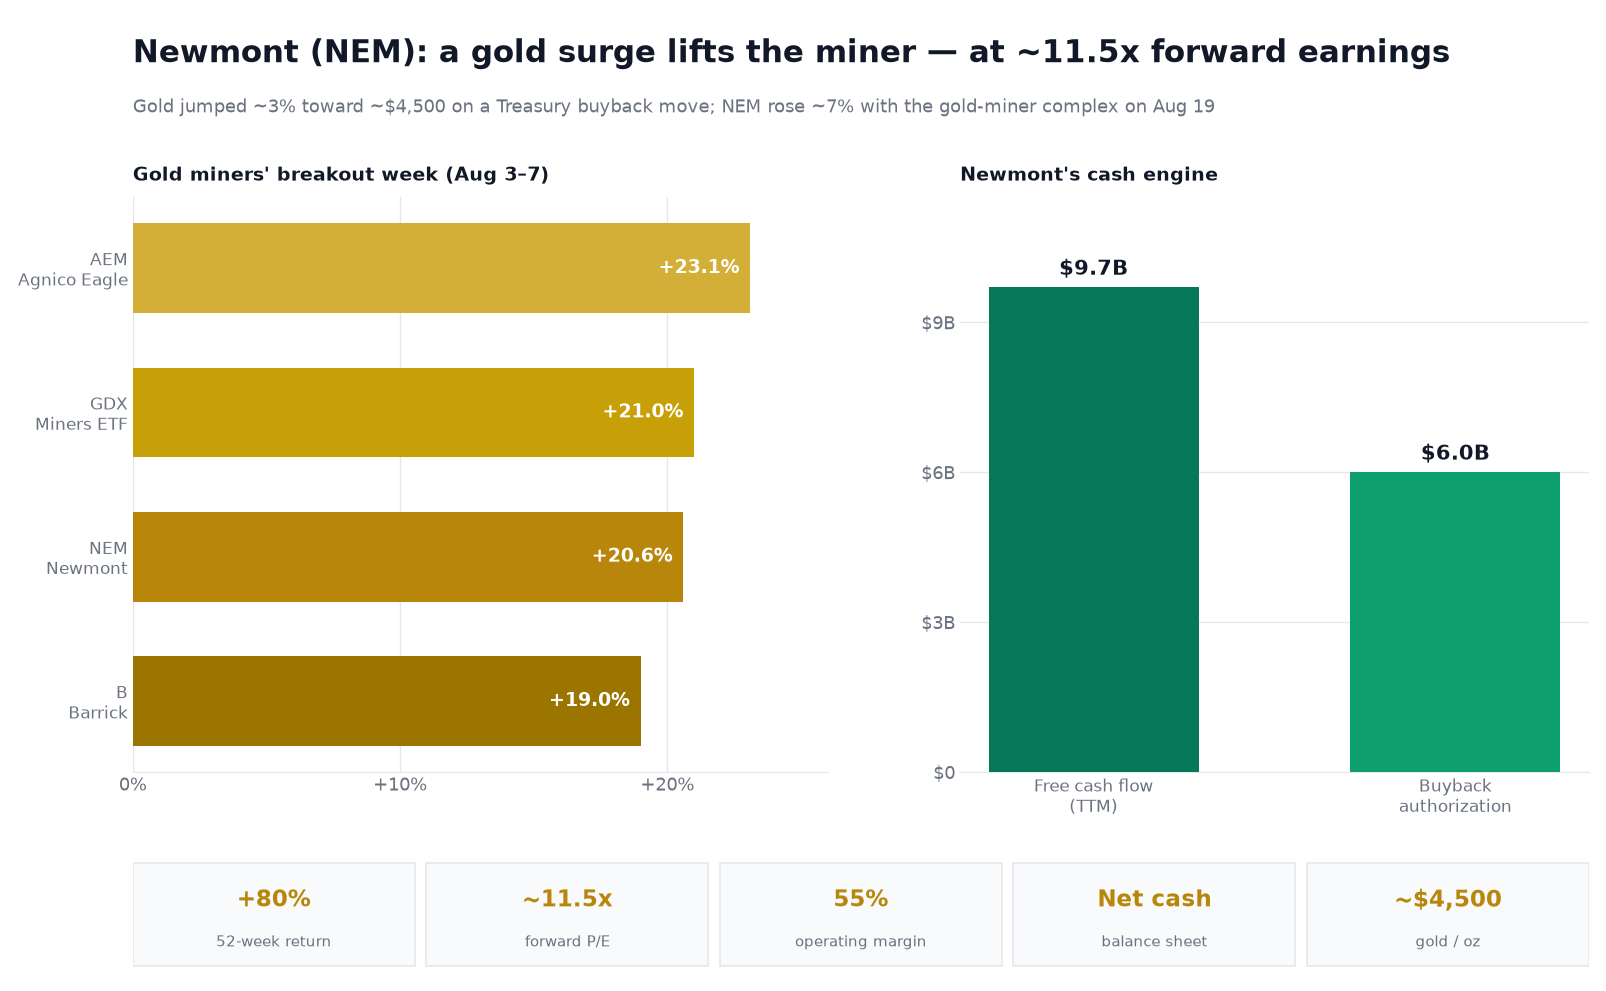
Newmont was up about 7% intraday, to roughly $124, on August 19 as gold surged toward ~$4,500 an ounce (after a U.S. Treasury move to buy back longer-dated debt lowered yields and the dollar) and the whole mining group rallied — the same group had already jumped ~20% in an August 3–7 breakout week. Newmont carries two extra layers: record free cash flow (~$9.7B trailing, a 55% operating margin, a net-cash balance sheet and a new $6B buyback), and a just-settled multi-year Barrick dispute over Nevada Gold Mines — Newmont agreed to pay $1.95B to fold in prime deposits, and the initial reaction favored it as Barrick fell ~6%. The paradox: after an ~80% one-year run, NEM still trades at only ~11.5× forward earnings, reflecting the market's assumption that high gold won't last. Analyst targets from $67 to $170 are really a bet on the gold price.

Why Newmont stock jumped — gold's surge, and a cheap miner
On Wednesday, August 19, 2026, Newmont (NYSE: NEM) was up about 7% intraday, to roughly $124, from a $115.98 prior close [1]. The move was less about a single Newmont headline than about the metal it digs out of the ground. On the day, gold jumped roughly 3% toward about $4,500 an ounce after the U.S. Treasury unexpectedly expanded its buybacks of longer-dated debt, pushing bond yields and the dollar lower — a classic tailwind for bullion, which has been one of the standout assets of the past year as investors seek a haven from elevated yields, inflation worries and geopolitical risk [8]. Gold miners are leveraged to that price — their revenue rises quickly with the metal while many operating costs move more slowly — so a jump in gold becomes a larger jump in the miners, and the whole complex, Newmont included, surged together [8].
That leverage has produced an explosive run. In an earlier "breakout week" (August 3–7), the whole group surged together — Agnico Eagle up about 23%, the VanEck Gold Miners ETF (GDX) up about 21%, Newmont up about 21%, and Barrick up about 19% [8]. Newmont's August 19 gain is another leg of that gold-driven move, not a solo event. But Newmont carries an extra story of its own — and, unusually for a stock up 80% in a year, a strikingly cheap valuation.
The cash engine: record free cash flow at ~11.5× forward earnings
Newmont is the world's largest gold miner, and high prices have turned it into a cash machine. Strong realized gold prices pushed free cash flow to about $9.7 billion over the trailing twelve months — including an all-time quarterly record of $3.1 billion in the first quarter (on realized gold near $4,900 an ounce) and another $2.2 billion in the second (near $4,414) — at an operating margin above 55% [3][5]. The company is returning that cash aggressively: a new $6 billion share-buyback authorization, a rising dividend, a share count already down about 9% over two years, and more than $4.6 billion of proceeds from selling non-core mines. It carries a net-cash balance sheet — about $9 billion of cash against $5.6 billion of debt [3].
Here is the paradox: despite an ~80% one-year gain to near a 52-week high, Newmont trades at only about 11.5× forward earnings (and ~14.7× trailing) [3]. A common explanation is that the market prices gold miners for mean reversion — an assumption that today's roughly $4,500 gold, and the record profits it produces, will not last. The entire debate over the stock lives in that assumption: if gold stays elevated, Newmont is a cheap, cash-gushing compounder; if gold falls back, today's earnings are a cyclical peak and the "cheap" multiple is a value trap.
The Barrick settlement: Newmont came out ahead
Newmont's own recent catalyst is a truce. On August 10, Newmont and Barrick (NYSE: B, formerly GOLD) settled their long-running dispute over Nevada Gold Mines (NGM), the jointly owned complex that is the largest gold operation in the world. Under the deal, Newmont agreed to pay Barrick about $1.95 billion, and three prime deposits — Barrick's highly prospective Fourmile project and Newmont's Fiberline and Mike deposits — are to be folded into the NGM joint venture [6]. The settlement ends a fight that began when Newmont issued a notice of default in February 2026, accusing Barrick of letting NGM's performance slip and steering resources toward its wholly owned Fourmile project, and it removes a key obstacle to Barrick's planned public listing of its North American gold assets [6]. The initial share-price reaction favored Newmont: on August 10, Newmont rose about 3.8% while Barrick fell about 6.4% — though Barrick also reported quarterly results that day, so the settlement was not the sole driver — suggesting investors viewed the deal's economics more favorably for Newmont [6].
Why it matters
Newmont is the cleanest large-cap way to understand what gold's record run is doing to corporate cash flows — and it is the mirror image of the stocks that have dominated 2026's headlines. The same environment of elevated yields, sticky inflation and geopolitical risk that has pressured high-multiple, high-beta names like AI-power and richly valued AI-hardware plays has driven investors into gold, and the miners' operating leverage has turned a strong metal into extraordinary profits. Whether that is a durable regime change or a late-cycle blow-off is the trillion-dollar question — and Newmont, at a single-digit-teens multiple with a fortress balance sheet, is where the market is expressing its doubt that gold can stay this high.
How the gold miners traded — the breakout week
Newmont's advance is part of a powerful, sector-wide move as gold has surged; in an earlier breakout week (August 3–7) the group rose in near-lockstep [8]:
| Name (ticker) | Aug 3–7 breakout week | Read-through |
|---|---|---|
| AEM — Agnico Eagle | ≈+23% | The other senior producer; up ~30% in August on the same gold surge [8] |
| GDX — VanEck Gold Miners ETF | ≈+21% | The sector proxy; it finished that week near $90 and has since traded to multi-year highs as gold pushed higher [8] |
| NEM — Newmont | ≈+21% | Moving with the group, plus its own Barrick-settlement tailwind and record cash flow [1][6] |
| B — Barrick (formerly GOLD) | ≈+19% | Rode gold higher, but lagged the group after ceding value in its August 10 settlement with Newmont [6] |
That the whole group moved together — with Newmont near the top, and again on August 19 — confirms this is a gold-price story first. Newmont's edge is the extra layer: the settlement and the industry's best free-cash-flow profile [8].
What the Street did with it
The recent analyst moves have all been upward, chasing the gold rally: Bank of America's Lawson Winder raised his target to $145 (from $135), CIBC's Anita Soni to $170 (from $168), and Scotiabank's Tanya Jakusconek to $149 (from $147) [7]. Yet the consensus 12-month target sits near $132 — only about 7% above the price — with an extraordinary range from about $67 to $170 [7]. That spread, unusually wide for a $130 billion company, is not a disagreement about Newmont's execution; it is a disagreement about the price of gold, which every one of those targets ultimately encodes [7].
What to watch
- The gold price. Newmont's earnings, cash flow and valuation all hinge on bullion; watch the spot price (recently ~$4,500/oz) as the single most important variable [8].
- Capital returns. Watch buyback execution against the new $6 billion authorization and any dividend increases as free cash flow compounds [3].
- Nevada Gold Mines. With the Barrick dispute settled and Fourmile, Fiberline and Mike folded in, watch NGM's production and cost trajectory — the operational payoff Newmont paid $1.95 billion to secure [6].
- Costs and reserves. Watch all-in sustaining costs and reserve replacement; the durability of miner margins depends on both. Moves are tracked on the NEM stock page and the earnings calendar [5].
Illustrative valuation sensitivity
The scenarios below are a descriptive, author-weighted exercise — not a forecast, target, recommendation, or intrinsic fair-value calculation, and explicitly not a view on the direction of gold. They are an illustrative share-price scenario range informed by Newmont's earnings power (a forward P/E near 11.5×) and by the analyst target distribution (low ~$67, average ~$132, high ~$170), which in turn largely encodes analysts' differing assumptions about the gold price. The $170 upside is anchored to the current Street high and the ~$132 middle to the consensus; the ~$90 downside is an author-chosen case (above the $67 low). The weights are the author's editorial judgments, not empirically derived probabilities, and sum to 100%.
| Scenario | Illustrative price | Weight | Key drivers |
|---|---|---|---|
| Upside | ~$170 | 30% | Gold stays elevated or rises, record free cash flow proves durable, buybacks shrink the share count, and the market grants a higher multiple for a cash-returning senior producer — toward the Street-high [7]. |
| Middle | ~$132 | 45% | Gold holds near current levels; Newmont keeps minting cash and returning it, and the stock tracks the consensus target as the "peak-earnings" discount only partly unwinds [7]. |
| Downside | ~$90 | 25% | Gold retraces meaningfully; free cash flow falls from record levels, and a stock that looked cheap on peak earnings de-rates toward the lower half of the target range [3][8]. |
Weighting those (0.30 × $170 + 0.45 × $132 + 0.25 × $90) gives an author-weighted reference value near $133, roughly in line with both the consensus target and the ~$124 quote [1]. The honest takeaway is that the width of the band is driven largely by one variable — the gold price — which is why a low-multiple, cash-rich, net-cash miner still carries genuine two-sided risk. This is a Street-target-based scenario exercise and descriptive analysis of a market move, not investment advice.
NEM data snapshot — August 19, 2026 (intraday)
| Figure | Value | As-of / source |
|---|---|---|
| Intraday quote | $123.94 (+6.86%); ~$124.69 (+7.5%) earlier | Aug 19 — StockAnalysis / Change Feed [1] |
| Prior close | $115.98 | Tue, Aug 18, 2026 [1] |
| 52-week price change / range | ≈+80% over 52 weeks; 52-week range $67.20–$134.88 (~8% off the high) | As of Aug 19 [3] |
| Market cap / EV | ≈$130B (1.05B shares); enterprise value ≈$126B | Aug 19 — StockAnalysis [3] |
| Valuation | Forward P/E ≈11.5×; trailing P/E ≈14.7×; price-to-sales ≈5.1× | Aug 19 — StockAnalysis [3] |
| Financials (TTM) | Revenue ≈$25.8B (+25%); net income ≈$8.6B (EPS $7.90); operating margin ≈55%; free cash flow ≈$9.7B | TTM — StockAnalysis [3] |
| Balance sheet / dividend | Cash ≈$9.0B vs total debt ≈$5.6B (net cash); dividend yield ≈0.8% | Aug 19 — StockAnalysis [3] |
| Capital returns | New $6B buyback authorization; share count −9% over two years; $4.6B+ non-core divestiture proceeds | 2026 — company [5] |
| Gold price | Jumped toward ≈$4,500/oz on Aug 19 (spot ~$4,490, futures ~$4,550) on a Treasury longer-dated buyback; up sharply year over year | Aug 2026 — market data [8] |
| Barrick settlement | Newmont agreed to pay Barrick ~$1.95B; Fourmile, Fiberline & Mike into NGM; initial reaction favored Newmont (NEM +3.8%, Barrick −6.4% on Aug 10) | Aug 10 — company / coverage [6] |
| Analyst reaction | Consensus Buy, avg target ≈$132 (range ~$67–$170); recent raises: BofA $145, CIBC $170, Scotiabank $149 | Aug 2026 — market coverage [7] |
The August 19 figures are intraday snapshots that moved through the session, not closing prices.
The setup at a glance
| Question | Answer |
|---|---|
| Why did Newmont stock jump on August 19? | Chiefly because gold surged (up ~3% toward ~$4,500/oz after a U.S. Treasury move to buy back longer-dated debt pushed yields and the dollar lower), and gold miners are leveraged to bullion. The whole group rallied; Newmont was up ~7% intraday, helped by its own record cash flow and its recently settled Barrick dispute [1][8]. |
| Why is a stock up ~80% in a year still "cheap"? | Because it trades at only ~11.5× forward earnings — the market prices gold miners for mean-reverting gold, assuming today's record prices and profits won't last. If gold stays high, Newmont is cheap; if gold falls, today's earnings are a cyclical peak [3]. |
| What was the Barrick settlement? | On August 10, Newmont and Barrick settled a multi-year dispute over their jointly owned Nevada Gold Mines complex. Newmont agreed to pay Barrick ~$1.95 billion, and three prime deposits (Fourmile, Fiberline, Mike) join the joint venture. The initial reaction favored Newmont — NEM rose ~3.8% while Barrick fell ~6.4% that day [6]. |
| How much cash is Newmont generating? | Record amounts. Free cash flow was about $9.7 billion over the trailing twelve months (including an all-time-record $3.1 billion quarter) at a ~55% operating margin, funding a new $6 billion buyback, a rising dividend, and a net-cash balance sheet [3][5]. |
| What is the single biggest risk? | The gold price. Newmont's earnings, cash flow and valuation all hinge on bullion staying elevated; a meaningful retracement would cut free cash flow and could de-rate the stock, which is why analyst targets range from $67 to $170 [7][8]. |
| What do analysts think? | Buy-tilted, with an average target near $132 (only ~7% above the price) and recent target raises (BofA $145, CIBC $170). The wide $67–$170 range reflects disagreement about gold, not about Newmont's operations [7]. |
Newmont (NEM) stock FAQ
Why did Newmont (NEM) stock jump on August 19, 2026?
Chiefly because gold surged — bullion jumped about 3% toward about $4,500 an ounce on August 19 after the U.S. Treasury unexpectedly expanded its buybacks of longer-dated debt, pushing bond yields and the dollar lower — and gold miners are leveraged to the metal, since their revenue rises quickly with the gold price while many costs move more slowly. Gold has been one of the standout assets of the past year, and the whole mining group rallied (Agnico Eagle, the GDX ETF and Barrick all up around 20% in an earlier August 3–7 breakout week). Newmont was up about 7% intraday, and also has two company-specific tailwinds: record free cash flow and a recently settled dispute with Barrick over their shared Nevada Gold Mines complex.
Why is Newmont still 'cheap' after rising about 80% in a year?
Because it trades at only about 11.5 times forward earnings (and about 14.7 times trailing), which is low for a company generating this much cash. Gold miners are valued this way on purpose: the market assumes today's roughly $4,500 gold price — and the record profits it produces — will not last, so it discounts current earnings as a cyclical peak. The entire debate over the stock is that assumption. If gold stays elevated, Newmont is a cheap, cash-gushing business; if gold falls back, today's earnings are the top of the cycle and the low multiple is a value trap.
What was the Newmont–Barrick Nevada Gold Mines settlement?
Newmont and Barrick jointly own Nevada Gold Mines (NGM), the largest gold-mining complex in the world, and had been in a multi-year dispute over how it was run. On August 10, 2026 they settled: Newmont agreed to pay Barrick about $1.95 billion, and three prime deposits — Barrick's Fourmile project and Newmont's Fiberline and Mike deposits — are to be folded into the joint venture. The settlement ended a fight that began with Newmont's February 2026 notice of default (alleging Barrick had let NGM's performance slip) and removed a key obstacle to Barrick's planned public listing of its North American assets. The initial share-price reaction favored Newmont: on August 10 its stock rose about 3.8% while Barrick's fell about 6.4% (though Barrick also reported results that day), suggesting investors viewed the deal's economics more favorably for Newmont.
How much cash is Newmont generating?
Record amounts, thanks to high gold prices. Free cash flow was about $9.7 billion over the trailing twelve months — including an all-time quarterly record of $3.1 billion in the first quarter of 2026 — at an operating margin above 55%. Newmont is returning that cash aggressively: it approved a new $6 billion share-buyback authorization (its fourth since 2024), raised its dividend, cut its share count by about 9% over two years, and generated more than $4.6 billion from selling non-core mines. It also carries a net-cash balance sheet, with about $9 billion of cash against $5.6 billion of debt.
What is the biggest risk to Newmont stock?
The gold price, by a wide margin. Newmont's revenue, earnings, free cash flow and valuation all depend on bullion staying elevated near its current record levels. Because miners are leveraged to the metal, a meaningful drop in gold would cut Newmont's cash flow disproportionately and could de-rate the stock, even though it looks inexpensive today. That single dependency is why analyst price targets span such an enormous range — from about $67 to $170 — even though there is little disagreement about the quality of Newmont's operations. This is descriptive analysis, not a recommendation, and not a forecast for the price of gold.
Why are gold and gold miners rising in 2026?
Gold has been one of the standout assets of the past year, trading around $4,500 an ounce, as investors have sought a haven from elevated interest rates, sticky inflation and geopolitical risk — the same forces that have pressured expensive, high-beta growth stocks. Central-bank buying and safe-haven demand have supported the metal, and moves that lower bond yields and the dollar (such as the Treasury's August buyback of longer-dated debt) give it further lift. Gold miners have outperformed bullion itself because of their operating leverage: when the gold price rises faster than mining costs, the extra revenue flows disproportionately into profits and cash flow, which is exactly what has happened to Newmont.