Consumer & Retail
Tapestry (TPR) Stock Drops 16% as FY2027 Growth Outlook Triggers a Derating
Tapestry closed down 16.5% at $128.39 after fiscal 2026 results — despite beating on the quarter, guiding fiscal 2027 EPS in line with consensus and raising its dividend 16%. The revenue guidance midpoint was only 0.1–0.2% light. Because the forward earnings estimate barely moved, the decline was a reset in the multiple rather than a cut to next year's earnings: revenue growth slows from +14% to about +5.8% comparable and adjusted EPS growth from +38% to about +11.3%, while Kate Spade is guided to a second straight high-single-digit decline and a continued operating loss — leaving Coach, guided to high-single-digit growth after a 23% year, to supply more than all of the company's net growth.

Why Tapestry stock fell on August 13
On Thursday, August 13, 2026, Tapestry (NYSE: TPR) closed down 16.49% at $128.39, from a $153.74 prior close, after reporting fiscal fourth-quarter and full-year results before the open [1][2][8]. This piece was first written during the session and has been updated to settled closing prices.
The obvious explanation is that guidance missed. It did — but only barely, and by how much depends on whose consensus you use. That distinction matters enough to lay out explicitly [1][4][16]:
| Measure | Tapestry | Consensus | Verdict |
|---|---|---|---|
| Q4 FY26 adjusted EPS | $1.32 | $1.25–$1.28 (varies by provider) | Beat |
| Q4 FY26 revenue | $1.876B (+9% reported, +11% pro forma cc) | ≈$1.86B | Beat |
| Q4 Coach revenue growth | +15% reported (+14% cc) | +15.5% (FactSet) | Slight miss |
| FY27 revenue guide | $8.4–$8.5B (mid $8.45B) | $8.46B (Reuters/LSEG) to $8.47B | Miss, ~0.1–0.2% |
| FY27 adjusted EPS guide | $7.80–$7.90 (mid $7.85) | $7.84 (LSEG) / ≈$7.87 (FactSet) | In line — above on one, ~2c below on the other |
| Q1 FY27 adjusted EPS guide | ≈$1.55 | $1.48 | Above |
Read together: the quarter beat, next year's earnings guide landed essentially on consensus rather than below it, and the revenue guide was light by a rounding error. The one genuine soft spot is the last place a bull would want it — Coach's own fourth-quarter growth came in a touch under expectations [16].
So a company that beat on the quarter, guided next year's earnings in line, raised its dividend 16% and hit its investor-day targets two years early lost roughly a sixth of its market value in a morning. What repriced was not the level of the dollars. It was the growth rate — and, underneath it, which brand is producing the growth.
A valuation reset, not an earnings cut
The point is not that the multiple fell — dividing a lower price by the same earnings number will always show that. It is that the earnings number itself did not move. Going into the print, the Street's fiscal 2027 consensus was about $7.84 on LSEG data (roughly $7.87 on FactSet); management's new midpoint is $7.85, inside that range. So the forward earnings base was essentially unchanged, and the stock still went from roughly 19.6x expected fiscal 2027 earnings at Wednesday's $153.74 close to about 16.4x at Thursday's $128.39 close — a contraction of 16.49%, matching the decline in the share price exactly [2][4][16]. That makes the selloff primarily a reset in what investors will pay, rather than a reaction to a lower expectation of what Tapestry will earn next year.
That does not tell us precisely what the market is discounting — a lower probability that the guide is met, weaker growth beyond fiscal 2027, or simply a higher risk premium are all consistent, and none is directly observable. What it rules out is the simplest version of the earnings-cut story: management's fiscal 2027 earnings midpoint was essentially unchanged from the pre-print consensus. Post-print analyst estimates are a different dataset, and were still being revised as the session unfolded.
Why pay less, then? Because fiscal 2026 was, on the company's own framing, a record year, and fiscal 2027 is guided to grow at a fraction of that rate [1]:
| Measure | FY2026 actual | FY2027 guidance (midpoint) | Change in rate |
|---|---|---|---|
| Revenue | $8.004B, +14% reported (+18% pro forma reported, +17% pro forma cc) | $8.45B, ≈+5.8% on the comparable 52-week basis (company: mid-single-digit) | ≈−8 pts reported, ≈−11 pts pro forma |
| Adjusted EPS | $7.05, +38% | $7.85, ≈+11.3% (company: low-double-digit) | −26.7 pts |
| Non-GAAP operating margin | 23.4%, +340 bps | ≈+50 bps expansion | −290 bps of expansion |
Two basis notes, because they cut in opposite directions. The fiscal 2026 base of $8.004 billion still contains $14.6 million of Stuart Weitzman revenue while the fiscal 2027 guide contains none, so the like-for-like rate is about 5.8% rather than the 5.6% a raw division gives. Separately, fiscal 2027 contains a 53rd week that the guidance excludes, and which the company expects to add roughly another percentage point to annual revenue growth — neutral to full-year operating margin [1][15]. So the reported headline will flatter the comparable number; the underlying step-down is the 5.8%.
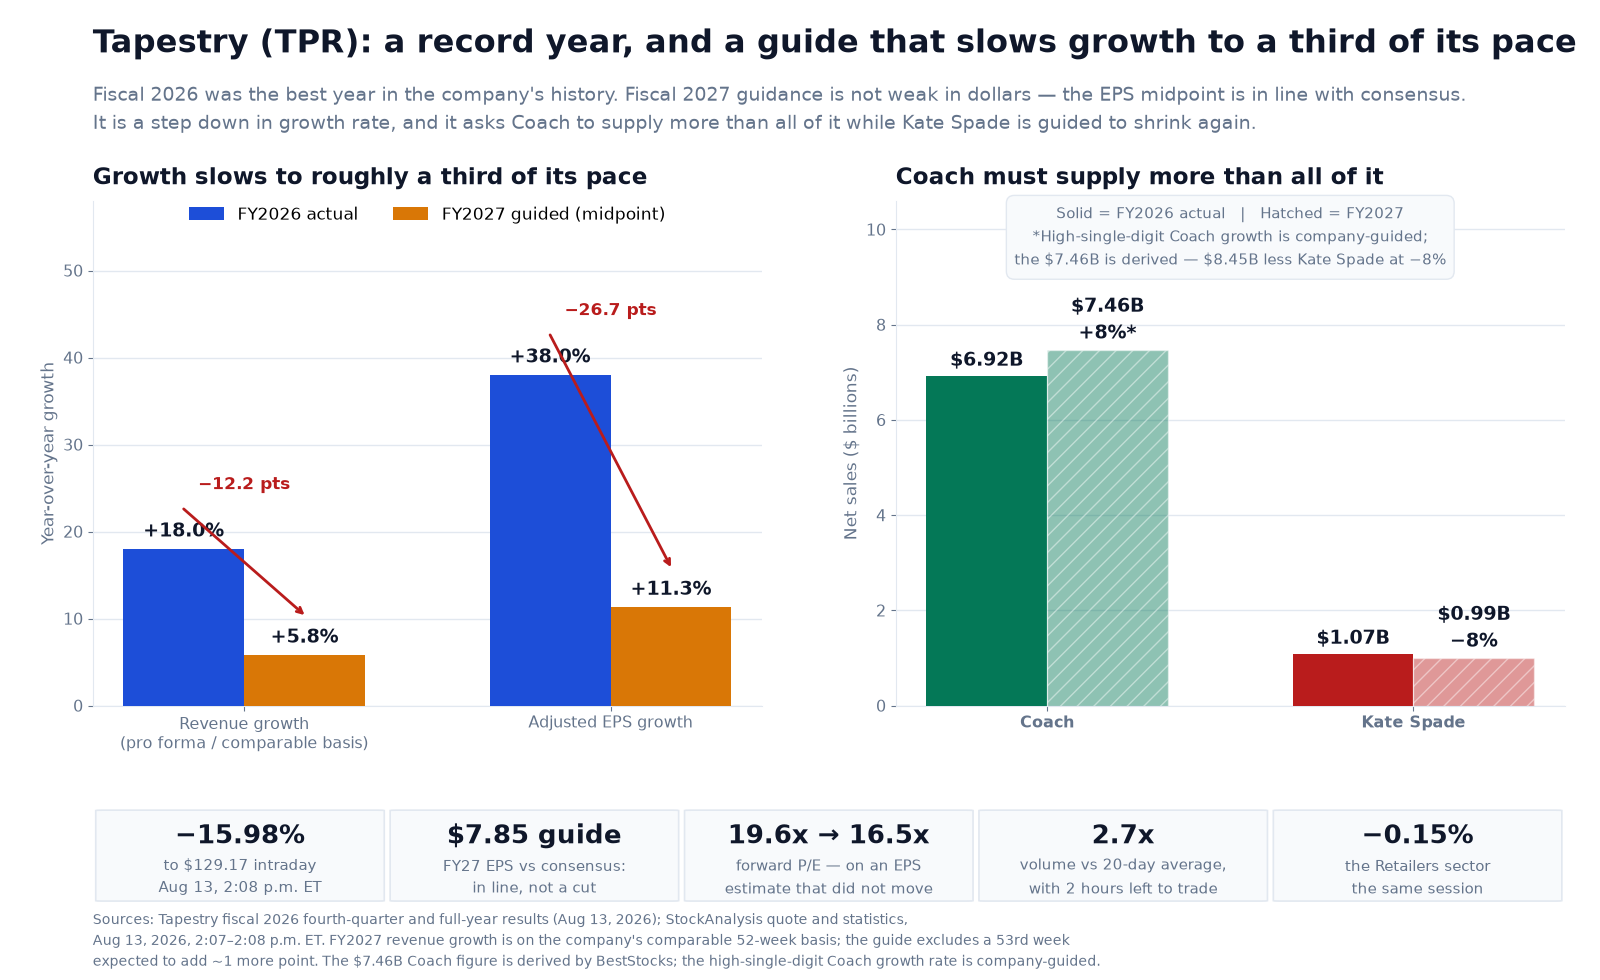
"Halving" is too generous a description. Compared like with like — on the continuing-business basis the company itself emphasises — growth slows from 17–18% in fiscal 2026 to about 5.8% at the fiscal 2027 midpoint, roughly a third of the prior year's rate. Adjusted EPS growth falls from 38% to about 11%, also under a third. A stock trading near 20x forward earnings was, implicitly, being underwritten by the left column. The guidance told investors to underwrite the right one. That is a derating, not a disappointment — the same mechanism that hit Micron when the market decided DRAM margins had peaked, Intuitive Surgical when procedure-growth guidance normalised, and Axon when margin expansion slowed. It is also the mirror image of Danaher, where the guidance itself was cut — Tapestry's was not.
Coach now drives virtually all of the growth
The detail that most coverage buried is the brand-level guidance. Kate Spade is guided to a high-single-digit revenue decline in fiscal 2027 — and to a continued operating loss, as the company keeps investing behind the brand [7][14]. That follows a fiscal 2026 in which the brand already fell 10% reported and 11% in constant currency, to $1.075 billion [1]. A turnaround that was supposed to be inflecting is instead guided to shrink for a second consecutive year, and to consume profit while it does.
Management was explicit about the other side of that trade: fiscal 2027 embeds high-single-digit growth at Coach [15]. Putting the two guides together gives the dollar shape. Taking 8% as the midpoint of the Kate Spade decline implies roughly $0.989 billion of Kate Spade revenue, and therefore about $7.46 billion at Coach on the comparable basis — approximately 7.9% growth, consistent with the company's stated high-single-digit Coach guide. The dollar figure is a BestStocks derivation; the growth category is management's own. The sensitivity is narrow either way: Kate Spade down 7% implies Coach up 7.7%; down 9% implies Coach up 8.1%.
Set that against what Coach just did. In fiscal 2026 Coach grew 24% reported and 23% in constant currency, to $6.915 billion, with fourth-quarter constant-currency growth of 14%. Those Coach-specific regional figures — North America up 10%, Greater China up 30%, Europe up 25% — ran well ahead of Tapestry's consolidated pro forma constant-currency numbers of roughly 7%, 28% and 19% respectively, which is precisely the point: the group's regional strength is Coach's regional strength [1][7].
One caveat belongs here rather than buried in the numbers. Coach's fourth quarter was strong but not flawless: reported growth of about 15% came in fractionally under a 15.5% FactSet consensus [16]. On its own that is a rounding error. In the context of a guide that asks Coach to carry more than all of next year's growth, it is the one data point that speaks directly to whether the engine can do what the guidance assumes — and it arrived pointing very slightly the wrong way.
The guidance therefore embeds a deceleration at Coach from roughly 23% to roughly 8%, while the second brand is guided to keep shrinking. With Stuart Weitzman divested in August 2025, there is no third leg. Coach was about 86.4% of reported fiscal 2026 revenue (roughly 86.5% of pro forma continuing revenue) — but the sharper way to put it is that because Kate Spade subtracts, Coach has to supply more than all of fiscal 2027's net revenue growth. The derivation, once, explicitly: against pro forma fiscal 2026 revenue of $7.9896 billion, the $8.45 billion midpoint implies about $460 million of net growth. Kate Spade down 8% subtracts roughly $86 million, so Coach has to add about $546 million — roughly 119% of the net increase. The precise percentage moves with the Kate Spade assumption, but the direction does not: any decline at Kate Spade puts Coach above 100% [1]. The near-term ask is steeper still: first-quarter guidance calls for Coach to grow at a low-teens rate while Kate Spade declines at a low-double-digit rate [15].
Chief executive Joanne Crevoiserat acknowledged the shortfall directly, saying Kate Spade's "top-line progress was more gradual than we planned," while pointing to a refreshed leadership bench at the brand — a new chief marketing officer and a new executive creative director — and about 2 million new customers [7]. Across the group, Tapestry added roughly 11.0 million new customers in fiscal 2026, about 35% of them Gen Z [1]. That is a genuine asset. It is also, for now, mostly a Coach asset.
It was not a sector move
Nothing in the tape suggests a group repricing of accessible luxury. On the same session, the closest listed comparables barely moved [9][10][11][12]:
| Name (ticker) | Aug 13 close | Trailing P/E | Context |
|---|---|---|---|
| TPR — Tapestry | −16.49% to $128.39 | ≈18.2x (on FY26 adj. EPS) | Its own FY27 guide [1][2] |
| RL — Ralph Lauren | −2.26% to $387.39 | 24.4x | Also guiding FY27 to mid-single-digit cc growth [9] |
| CPRI — Capri Holdings | +0.32% to $15.60 | 20.3x | Michael Kors weakness; guidance cut Aug 5 [10] |
| PVH — PVH Corp | +0.09% to $81.66 | 24.4x | Reports Aug 27 [11] |
| Retailers sector | −0.15% | — | TradingKey sector aggregate [12] |
Ralph Lauren is the instructive comparison. It guided fiscal 2027 constant-currency revenue growth to the mid-single digits — the same rate Tapestry just guided to — and it trades at a higher trailing multiple while closing down only 2.3% [9]. The market is plainly not refusing to pay for mid-single-digit growth in this group. What it charged Tapestry for was the change in trajectory off a +38% earnings year, and the concentration of the remaining growth in one brand.
What the Street did with it
Very little, yet — which is a caveat on every target figure quoted today. At the time of writing, the only price target carrying an August 13 date was Telsey Advisory's Dana Telsey, who maintained a Buy with a $175 target [5]. The rest of the visible coverage was set before the print: J.P. Morgan's Matthew Boss at $211 (raised from $205 on August 4, Overweight), Morgan Stanley's Alexandra Straton at $164 (August 3), Raymond James's Rick Patel at $165 (July 21), Bernstein at $180 (June 2, Outperform) and Evercore at $175 (May 8) [5][6]. Consensus figures differ by provider and should not be blended: StockAnalysis showed an average of $168.20 across 22 analysts, MarketBeat $173.88 [5][6]. Every one of those was struck when the fiscal 2027 growth rate was still an estimate rather than a guide, so the meaningful revisions are still to come.
Illustrative valuation scenarios
The scenarios below are a descriptive sensitivity on forward earnings, not a forecast, target, or recommendation. Each implied price is simply an earnings estimate multiplied by a price/earnings multiple; the multiples are anchored to observable comparables — Tapestry's own 19.6x forward multiple at Wednesday's close, Ralph Lauren at 24.4x trailing, Capri at 20.3x, and the $168.20 analyst-target average shown in our 2:08 p.m. ET snapshot (about 21.4x the guidance midpoint) [2][5][9][10]. The probabilities are the author's illustrative estimates and sum to 100%.
| Scenario | Implied price | Probability | Key drivers |
|---|---|---|---|
| Bull | ~$163 ($8.15 EPS × 20x) | 25% | Kate Spade's decline bottoms in the first half, Coach holds low-double-digit constant-currency growth, and Tapestry beats the top of its guide as it did in fiscal 2026 (+38% against a low-double-digit initial frame). The multiple recovers toward the pre-print level and the buyback removes ~5% of shares [1]. |
| Base | ~$137 ($7.85 EPS × 17.5x) | 50% | Guidance is delivered as given. Coach compounds at the derived ~8%, Kate Spade declines high-single-digits and stabilises late, margin expands ~50 bps. The multiple stays near today's derated level while the market waits for evidence on the second brand [1][7]. |
| Bear | ~$102 ($7.30 EPS × 14x) | 25% | Coach decelerates below the derived ~8% as the China and Europe comparisons harden, or Kate Spade's decline steepens past high-single-digits, forcing a guidance cut. A single-brand company on a falling growth rate carries a lower multiple; the 52-week low is $92.62 [2]. |
Weighting those (0.25 × $163 + 0.50 × $137 + 0.25 × $102) gives an illustrative blended value near $135, against the $128.39 close — roughly 5% above the price, and far below the $168.20 analyst-target average in that same snapshot, which had barely begun to reflect the new guide [5]. The honest reading is that a 16% one-day derating has moved the stock from expensive-for-the-new-growth-rate to approximately fair for it, with the outcome now hinging on two things the guidance asserts but has not yet demonstrated: that Coach can compound near 8% off a 23% year, and that Kate Spade's decline has a floor. This is descriptive analysis of a corporate event, not a recommendation to buy, sell, or hold any security.
TPR data snapshot — August 13, 2026 (settled close)
| Figure | Value | As-of / source |
|---|---|---|
| Prior close | $153.74 | Wed, Aug 12, 2026 [2] |
| Close | $128.39 (−$25.35, −16.49%) | Aug 13, 4:00 p.m. ET — StockAnalysis [2] |
| Corroborating close | $128.39 (−$25.35, −16.49%) | Aug 13, 4:00:03 p.m. ET — Yahoo Finance [8] |
| Day range | $127.78 – $135.78 (opened −14.6%; closed near the low) | Aug 13 session [2][12] |
| Volume (heavy) | 8,534,040 vs a 2,164,181 20-day average — ≈3.9x (Yahoo: 7,863,388 vs a 2,640,283 3-month average, ≈3.0x) | Full-session totals, Aug 13 — StockAnalysis / Yahoo Finance [2][3][8] |
| 52-week range | $92.62 – $164.80 (≈22% below the high, ≈39% above the low) | As of the Aug 13 close [2] |
| Market cap | ≈$25.60B (199.39M shares) | At the Aug 13 close [2] |
| Valuation | ≈16.4x the FY27 non-GAAP EPS midpoint ($7.85); ≈18.2x FY26 non-GAAP EPS ($7.05) | Computed at the $128.39 close [1][2] |
| Short interest | 16.53M shares, 8.18% of shares outstanding | July 31, 2026 settlement date [3] |
| Dividend | Raised 16% to $0.4625/quarter ($1.85 annualised) ≈ 1.44% yield at the $128.39 close (feeds still showed 1.24% on the trailing $1.60 rate) | Announced Aug 13 [1][2] |
| Analyst targets | Telsey $175 (Aug 13, Buy); pre-print: J.P. Morgan $211, Bernstein $180, Raymond James $165, Morgan Stanley $164. Averages: $168.20 (StockAnalysis, 22 analysts) / $173.88 (MarketBeat) | Mostly pre-print — revisions pending [5][6] |
StockAnalysis and Yahoo Finance agree to the cent on the $153.74 prior close, the $128.39 close and the −16.49% move. These are settled closing figures; an earlier version of this article, written during the session, carried intraday snapshots taken at about 2:08 p.m. ET ($129.17, −15.98%), corroborated at the time by the BestStocks change feed at $129.35 [13].
What to watch
- Kate Spade's quarterly trajectory against the high-single-digit decline guide. The brand has now missed its own turnaround timetable twice. Whether the decline shallows through fiscal 2027 — rather than simply continuing — is the single most important variable, because it determines how much Coach has to carry [7].
- Coach's constant-currency growth versus the guided high-single-digit rate. Greater China grew 30% and Europe 25% at Coach in the fourth quarter; those comparisons harden through the year. First-quarter guidance already asks for low-teens growth, so an early shortfall would be an immediate problem for the full-year bridge [1][15].
- Analyst revisions, which had barely started. Targets clustered from $164 to $211 were almost all set before this guide. Where the consensus resettles — and whether the $168.20 average holds — will say more than today's tape [5][6].
- Buyback execution. Roughly $1.35 billion of expected fiscal 2027 repurchases equates to about 5% of shares outstanding if executed near $129 — support for the share count behind the low-double-digit EPS guide, subject to prevailing prices and timing. In fiscal 2026 the company repurchased $1.35 billion at an average near $118 [1].
- The first-quarter print against the ~$1.55 EPS guide that already sits above consensus. Moves are tracked on the TPR stock page and the earnings calendar [4].
The setup at a glance
| Question | Answer |
|---|---|
| What was the news? | Fiscal 2026 fourth-quarter and full-year results before the open on Aug 13: Q4 revenue $1.876B (+9%) and adjusted EPS $1.32 (+28%), full-year revenue $8.004B (+14%) and adjusted EPS $7.05 (+38%), plus fiscal 2027 guidance of $8.4–$8.5B revenue and $7.80–$7.90 EPS [1]. |
| Did guidance miss? | Barely, and only on revenue. The $8.45B midpoint was 0.1–0.2% below a consensus reported between $8.46B and $8.47B. The $7.85 EPS midpoint was in line — above the $7.84 LSEG figure, ~2c below FactSet's ~$7.87 — and Q1 guidance of ~$1.55 beat a $1.48 consensus [4][16]. |
| Then why did it fall 16%? | The growth rate collapsed to roughly a third of the prior year's pace: revenue growth from +14% reported to ~+5.8% comparable, adjusted EPS growth from +38% to ~+11.3%, margin expansion from 340 bps to ~50 bps. Because the forward EPS estimate barely moved ($7.84 consensus to a $7.85 guide), the ~16.5% move was a reset in the multiple — 19.6x to ~16.4x — rather than a cut to next year's earnings [1][2][4]. |
| What is the Kate Spade problem? | It fell 10% reported (11% constant currency) in fiscal 2026 to $1.075B, and is guided to a further high-single-digit decline in fiscal 2027 — with a continued operating loss as investment continues. A second straight shrinking year [1][7][15]. |
| How much does Coach have to do? | Management guided Coach to high-single-digit growth. At the $8.45B midpoint with Kate Spade down ~8%, that implies roughly $7.46B at Coach, about +7.9% — the dollar figure is a BestStocks derivation, the growth category is guided. Because Kate Spade subtracts, Coach supplies more than 100% of net growth. Coach grew 23% in constant currency in fiscal 2026 [1][15]. |
| Was it a sector move? | No. Ralph Lauren fell 2.3%, Capri rose 0.4%, PVH rose 0.1% and the Retailers sector was down 0.15% the same session [9][10][11][12]. |
Tapestry (TPR) stock FAQ
Why did Tapestry (TPR) stock drop on August 13, 2026?
Tapestry closed down 16.49% at $128.39, from a $153.74 prior close, after fiscal 2026 fourth-quarter and full-year results. It was not an earnings miss: the quarter beat, with adjusted EPS of $1.32 against consensus figures of $1.25 to $1.28, and fiscal 2027 EPS guidance of $7.80 to $7.90 has a $7.85 midpoint that landed in line with consensus — marginally above the $7.84 LSEG figure and about two cents below the roughly $7.87 FactSet figure. The revenue guidance midpoint of $8.45 billion was only about 0.1% to 0.2% below a consensus reported between $8.46 billion and $8.47 billion. Because the forward earnings estimate barely moved, the decline was a reset in what investors will pay rather than a cut to next year's earnings — the forward P/E went from about 19.6x to about 16.4x. What changed was the growth rate: revenue growth is guided to fall from +14% reported to about +5.8% on a comparable basis and adjusted EPS growth from +38% to about +11.3%, with operating margin expansion dropping from 340 basis points to about 50.
What is wrong with Kate Spade?
Kate Spade net sales fell 10% reported and 11% in constant currency in fiscal 2026, to $1.075 billion, and the company guided the brand to a further high-single-digit revenue decline in fiscal 2027 — with a continued operating loss as investment continues, and a low-double-digit decline guided for the first quarter. That is a second consecutive shrinking year. Chief executive Joanne Crevoiserat said the brand's top-line progress was more gradual than planned. Tapestry has installed a new chief marketing officer and a new executive creative director at Kate Spade, and the brand added about 2 million new customers, but the turnaround has now missed its own timetable twice. Because Stuart Weitzman was divested in August 2025, the decline puts the entire growth burden on Coach.
How much growth does Coach have to deliver in fiscal 2027?
Management guided Coach to high-single-digit growth in fiscal 2027. Putting that together with the Kate Spade guide gives the dollar shape: if total revenue lands at the $8.45 billion midpoint and Kate Spade declines roughly 8% to about $0.989 billion, Coach reaches roughly $7.46 billion, or about 7.9% growth on its $6.915 billion fiscal 2026 base. The dollar figure is a BestStocks derivation; the growth category is the company's own. The sensitivity is narrow: Kate Spade down 7% implies Coach up 7.7%, and down 9% implies Coach up 8.1%. Because Kate Spade subtracts, Coach has to supply more than 100% of fiscal 2027's net revenue growth — and first-quarter guidance asks for low-teens Coach growth. That is a sharp deceleration from Coach's fiscal 2026 growth of 24% reported and 23% in constant currency, which is the core reason the market repriced the stock.
Was the Tapestry selloff part of a broader retail or luxury decline?
No. On the same session Ralph Lauren closed down 2.26%, Capri Holdings rose 0.32%, PVH Corp rose 0.09%, and the Retailers sector aggregate was down 0.15%. The move was company-specific. Ralph Lauren is the instructive comparison because it also guided fiscal 2027 constant-currency revenue growth to the mid-single digits, yet trades at a higher trailing P/E of 24.4x versus about 18.2x for Tapestry on fiscal 2026 adjusted earnings. The market is not refusing to pay for mid-single-digit growth in this group; it charged Tapestry for the change in trajectory off a +38% earnings year and for concentrating the remaining growth in one brand.
Is Tapestry stock cheap after the drop?
At the $128.39 close it trades at about 16.4x the $7.85 fiscal 2027 guidance midpoint and about 18.2x fiscal 2026 adjusted earnings of $7.05, below Ralph Lauren at 24.4x and Capri at 20.3x on a trailing basis. Guided adjusted free cash flow of about $1.7 billion against a $25.6 billion market capitalisation is roughly a 6.6% free-cash-flow yield, and management plans to return about $1.7 billion through a $1.35 billion buyback authorisation and a dividend raised 16% to $1.85 annualised. On the illustrative probability-weighted scenarios in this article, a blended value near $135 sits about 5% above the closing price, suggesting the derating has largely done its work rather than overshooting. This is descriptive analysis, not investment advice.